This tutorial shows GIS users how to easily create a distance matrix and calculate travel times between multiple origins and destinations using QGIS and the TravelTime plugin.
Introduction
A distance matrix is a two-dimensional array containing the distances between different locations. Creating a distance matrix can be beneficial for various reasons. For example, they are used in transport planning for calculating travel times for popular origin-destination routes. In retail store planning, they are used for calculating customer travel times from their homes to the retailers’ current locations, competitor locations and prospect locations.
There are multiple tools available for creating a distance matrix. For example, QGIS has a built-in Distance Matrix tool that is found under Vector, then clicking “Analysis Tools” and next, “Distance Matrix.” Additionally, you can search for plugins that calculate distances between locations using the search term “distance” under “Plugins” and clicking “Manage and Install plugins.”
Which tool you choose depends on the use case: For example, if you simply want to calculate straight line distances, the QGIS Distance Matrix tool will do, but for incorporating real routes, actual travel times with different transport modes, the TravelTime plugin would be the best fit. In this tutorial, we’ll calculate the travel times between multiple random origins and destinations using the TravelTime plugin, which can generate many origin-destination pairs very quickly.
How to use the plugin to create a matrix of travel times
Before we can use the TravelTime plugin and generate a distance matrix, we need to create some location data in the form of multiple origins and destinations. This is a two-step process consisting of generating some random UK postcodes and then geocoding them with the TravelTime plugin.
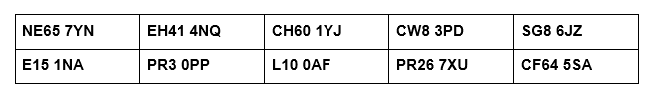
To generate some random UK origin and destinations, you can use this website and copy-paste the results inside two different Notepad files: one called origins.csv with five addresses and one called destinations.csv, containing 10 addresses. Save both files as CSV files with a header that names the address field, which is handy when importing them into QGIS later. In this tutorial, we’ll use the following five random origins:

As for the destinations, we’ll use the following ten UK postal codes:
Next, open up QGIS and create a new Project file. Add a basemap of your choice to your map canvas. Here, we used Esri Standard basemap that is available through the Quick Map Services plugin.
We’ll now geocode the addresses so they can be placed on a map. For this part of the tutorial, you’ll need to have the TravelTime plugin for QGIS installed and activated with an API key. You can get the plugin and API key here.
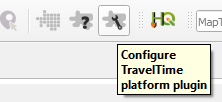
After receiving the API key, click the “Configure TravelTime platform plugin” button on the right of the TravelTime menu in QGIS and copy-paste the app ID and API key to start using the plugin:
This is the TravelTime menu button in QGIS for configuring the plugin. (Image: Eric van Rees)
To start geocoding, choose “Processing Toolbox'' in QGIS, choose the TravelTime plugin, then “Geocoding” under “Utilities.” Make sure the input fields match the image below.

Your input should match these QGIS TravelTime geocoding tool parameters. (Image: Eric van Rees)
Next, click “Run” and repeat the same procedure for the destinations table. The map below shows the origins in red and the destinations in blue, retitled as “origins'' and “destinations:”

The geocoded origins are red and the destinations are blue on the QGIS map. (Image: Eric van Rees)
To double-check if the tool geocoded all addresses, open up both attribute tables to see the amount of rows. The origins table should list five rows and the destinations table, 10.
With these geocoded addresses, we are ready to start using the TravelTime plugin and create a distance matrix with the travel times for each origin-destination trip.
Generating a distance matrix using public transport data
We’ll now generate two different travel matrices: one for public transport journeys and one using driving times. We’ll start with the distance matrix for public transport.
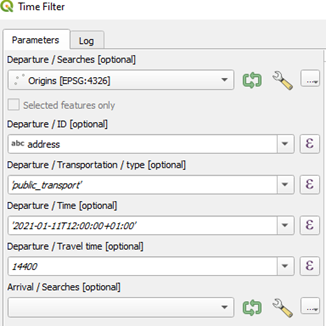
Using public transport data, we can perform an extensive distance analysis and calculate travel times from many origin-destination routes very quickly. The distance matrix functionality is accessed by choosing the TravelTime toolbox under Processing Toolbox and clicking “Simplified,” then “Time Filter Simple.”

Select the Time Filter – Simple tool from the TravelTime plugin for QGIS. (Image: Eric van Rees)
Next, select the origin and destination point features as inputs for the tool, and set the driving time to 240 minutes, which is the maximum amount of time that the tool accepts as input.

Your TravelTime Time Filter – Simple tool parameters window will look like this. (Image: Eric van Rees)
Click “Run” and look at the map, where new data has been added. You’ll see a new output layer with “reachable” and “unreachable” destinations within the maximum driving time from the different origins.

This is the output layer of the Time Filter – Simple tool. (Image: Eric van Rees)
A quick inspection of the map shows us three unreachable destinations in the north of the country, which is logical: These are probably hard to reach within four hours using public transport from the specified origin locations. Next, open the attribute table to see the distance matrix, which is the main output of the tool.
A quick inspection of the attribute table shows a total of 50 rows, which corresponds to the amount of possible origin/destination combinations (5x10). The second column, named “reachable,” contains a 0 or 1 which is a Boolean value with 0 corresponding to False and 1 to True.

These are the first two rows of the distance matrix for the Time Filter – Simple tool. (Image: Eric van Rees)
However, it’s difficult to make out the individual origin-destination information from this attribute table. Using the Advanced Time Filter tool, we can specify the different addresses for the different input and output fields, which are maintained in the output. For the origins, specify the Departure ID field as “address” and the travel time in seconds (four hours is the maximum amount, so 14400 seconds). Leave the arrival fields open, specify the Destinations layer as the Locations parameter and click “Run.”
The Time Filter – Advanced tool parameter window, completed. (Image: Eric van Rees)
Looking at the output attribute table, we see both the origin and destination address mentioned for each row, which makes it easier to see the different origin/destination pairs for each row in comparison with the Time Filter - Simple tool.

The output for the distance matrix for the Time Filter – Advanced tool will look like this. (Image: Eric van Rees)
Generating a distance matrix using driving time data
We’ll now create a distance matrix using drive time data instead of public transport data, which also returns the distance between the origin and destination. Repeat the same steps as before when creating the distance matrix for public transport, but now use “driving” as transportation type.
Looking at the output, we see a new feature layer added to the map with reachable and non-reachable locations. The tool now returns travel distance (in meters) to a reachable destination by car, in the column prop_distance that is listed in the attribute table. (You need to scroll to the far-right columns to be able to see it.)

The distance matrix using “driving” as transportation mode returns travel distances. (Image: Eric van Rees)
Using the Time Filter Advanced tool, we get more info about the origin-destination pairs per row. To double check that the listed distances are correct, we see that the first entry states an origin location/destination from Birmingham to Liverpool, with a travel distance of roughly 160km.

(Image: Eric van Rees)
We can check that this is correct using Google’s routing tool, which gives a corresponding travel distance by car.

Google’s routing tool returns a similar travel distance by car as the TravelTime QGIS plugin for the Birmingham-Liverpool trip. (Image: Eric van Rees)
Conclusion
The TravelTime plugin has the ability to create travel time and distance matrices and assess public transport data. In the examples above, we have shown that we can create many origin-destinations at once, along with the travel distances using the Time Filter tool from the plugin.
Such information is very valuable for a number of real-life use cases. For example, the tool can be used to see how many employees of a company can reach a working location from their homes within a certain time limit. By adding a GIS layer of demographic data to the travel times, it becomes possible to see how many people of a certain demographic live within a commutable distance of a healthcare facility or shop. The add-in can also be used to analyze what local amenities a new office location requires, e.g. walking travel time to points of interest such as supermarkets, cafes and more.