This article is brought to you by Esri. Location intelligence for smart cities is crucial for realizing the true potential of their IoT data
There is no doubt that the Internet of Things (IoT) is the future. IDC estimates that there will be 41.6 billion connected IoT devices in 2025 generating 79.4 billion terabytes of data. Location data is becoming more crucial in the IoT landscape and with all that location data, you need the right technology to help convert raw data into something useful. Location intelligence can help organizations put their sensor data in context, discover where there may be broader trends or issues, and identify threats or causal factors that the sensor data or the network itself can’t tell you. Here, we’ll dive into some upcoming use cases.
The connected car market was valued at USD $24.1 billion in 2019 and is expected to grow 18 percent by 2025. Cisco and Esri are working to help cities and organizations collect, monitor, and utilize data from connected cars. Cisco’s Edge Intelligence is driving edge-based safety applications and enables seamless data collection from roadway infrastructure, helping cities prepare to bring in data from thousands to millions of connected vehicles in the next few years. Using Esri’s latest IoT software as a service (SaaS) offering ArcGIS Velocity, the raw vehicle sensor data can then be used to visualize and analyze clusters of incidents such as traffic congestion, air bag deployments, hard braking, and more, all in real time. This knowledge can be used as an early indicator of accidents and help city transit agencies better prepare for emergency responses. ArcGIS Velocity also supports big data analytics, which means it can also be used to collect data over time to understand micro-level traffic patterns.

Another emerging use case is threat monitoring with IoT data. Esri is using Velocity to perform threat monitoring for its offices across the US. Velocity helps ingest multiple feeds of information such as data from third-party providers on protests, crimes, or weather hazards. It then helps determine which ones are potentially impacting Esri facilities, infrastructure, or staff. When an incident occurs, an email or text notification can be sent to the appropriate people. This workflow can be used for daily operations at a national or global scale as well as to monitor incidents during a special event.
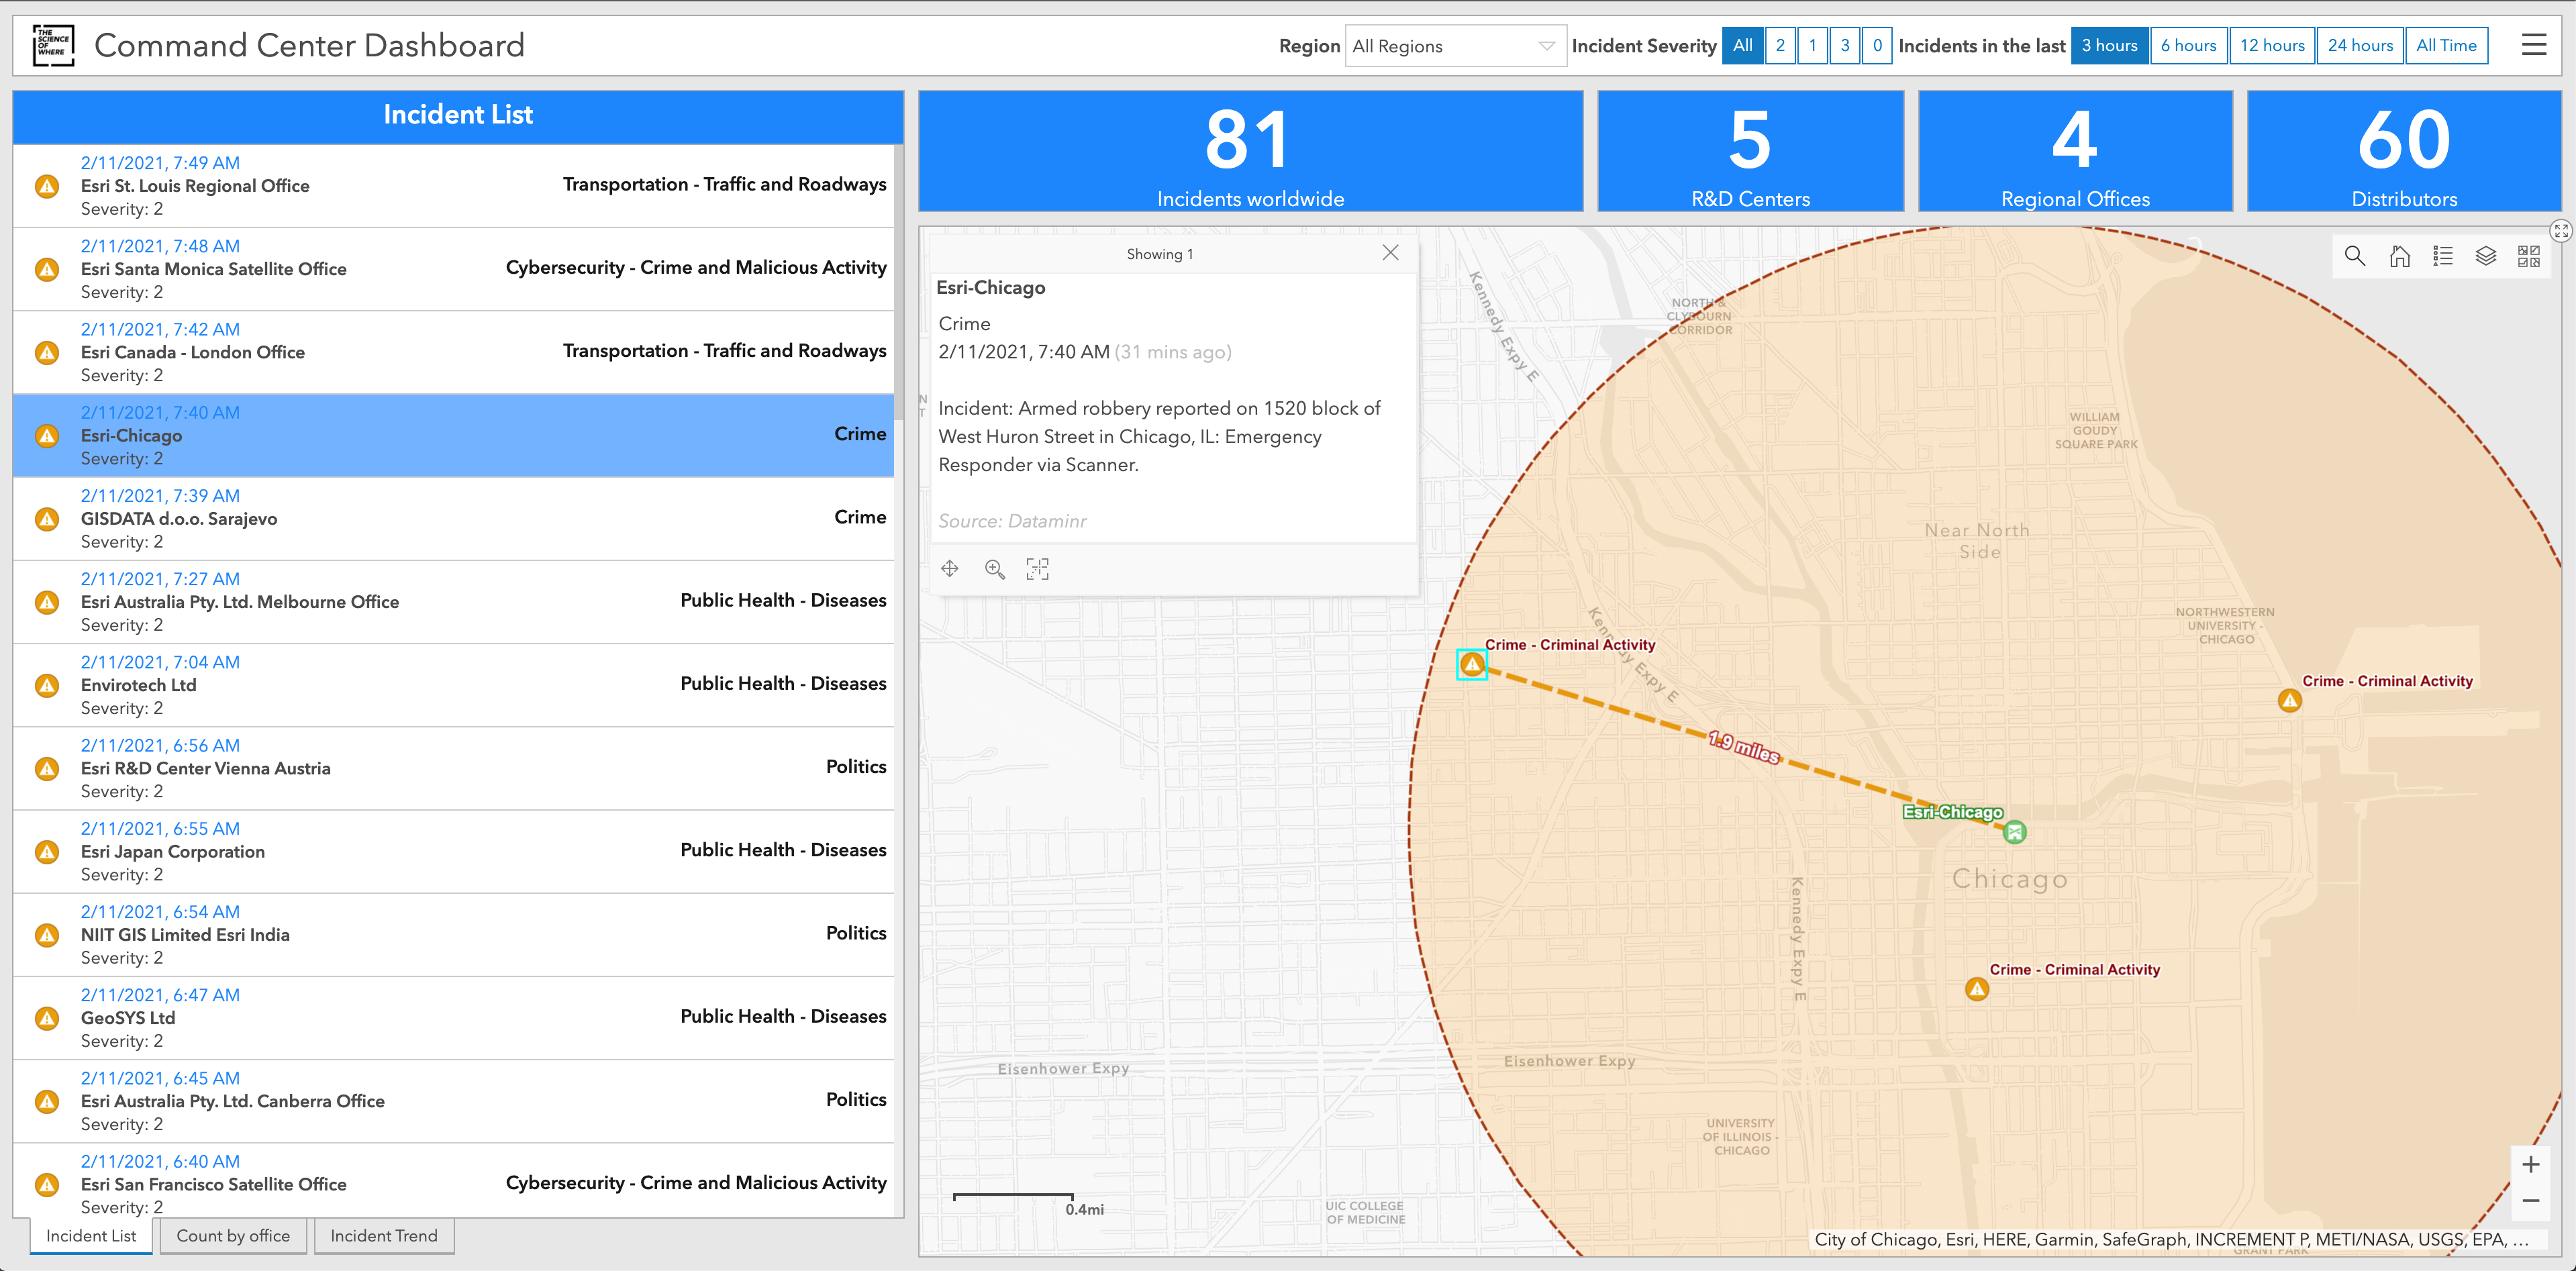
Velocity dashboard for threat monitoring around Esri offices across US
Another burgeoning market is the digital twin. The global digital twin market was estimated to be USD $3.1 billion in 2020, with growth projections of USD $48.2 billion by 2026. The approach here is to create virtual replicas of facilities, systems or even cities, and then connect the virtual replica to real-time information feeds from sensors and other devices. For example, organizations can create digital replicas of their facilities, such as a power plant and use real-time and historic data to identify where maintenance issues are occurring, which reduces downtime. On a larger scale, city officials can use a digital twin— a virtual model of the city’s roads, buildings and public spaces — and location data from sensors to plan transportation systems or analyze and respond to local energy and environmental changes. Residents can visualize the impact of a new construction before it begins, and first responders can prepare for potential emergency scenarios.
ArcGIS Velocity – Real-time and Big data analysis capability of ArcGIS Online
ArcGIS Velocity empowers you to bring together sensed data from different sources and combine them for a more complete picture and at greater data scales and velocities than have ever been brought to a comprehensive GIS system. Velocity enables end user configuration of complex technical tasks, like IoT system integration and streaming analysis, instead of requiring database tuning or custom development. Users choose between data protocols and formats, apply transformations, define incidents to detect, and set output rules for notifications and data storage, all within an entirely visual programming environment. Get more information about Velocity here.