Editor's Note: Co-authors for this article included the following from Williston State College: Ron Radle (Advanced GIS student); and faculty members James Stout (English), Susan Zimmerman (Biology), Lance Olson (Physics), Sher Hakes (Graphic Design), Ken Quamme (Computer Technology), Taryn Sveet (Speech), and Maeve MacSteves (Entrepreneurship)
The U.S. Department of Labor developed its High Growth Job Training Initiative with a two-fold purpose: 1) to identify high-growth, high-demand sectors of the U.S. economy which had solid job opportunities but were not filled due to the lack of qualified workers; 2) to determine how to prepare 21st century workers with the skills they would need for successful careers in those high-growth industries. Geospatial technology was identified as one of the nation’s fastest , growing industries, in high demand because of its capability to provide vital information to managers and workers in a diverse range of areas within federal, state and local governments, regulated industries and the general public.
The growth of geospatial technology would be even greater if more well-trained workers were available. Many industries and agencies cannot fill open positions, even in this time of high unemployment. The Integrated Geospatial Education and Technology Training (iGETT) project, funded by the National Science Foundation with a 2012 grant to the National Council for Geographic Education, was developed to address the growing workforce need for geospatially-trained employees able to use remote sensing and geographic information systems (GIS).
To accomplish its mission, iGETT provided 40 GIS faculty at 2-year colleges with the education and training needed to teach remote sensing as part of their geospatial program and, in addition, provided the necessary geospatial technology software to each of the represented colleges in perpetuity, thus making it possible to expand the pool of well-educated graduates. As part of the iGETT training, each iGETT participant was required to develop a geospatial exercise integrating remote sensing and GIS, focused on a real-world problem.
As a participant in iGETT, I contacted my local city/county officials and asked if they needed help with geospatial technology. Their response was an immediate “yes!” My city, Williston, North Dakota (“City”), population 15,000, is located on the north bank of the Missouri River in northwest North Dakota, approximately 20 miles east of the Montana border and 60 miles south of the Canadian border. (Latitude, Longitude: 48.15472,
-103.61276; UTM Zone 13N U; Landsat-7 WRS: P34 R27.) The “City” is located 227 miles downstream from the U.S. Army Corps of Engineers (USACE)-operated Fort Peck Dam. Built in the 1930s, Fort Peck Dam is the largest hydraulically filled, multi-purpose dam and the fifth largest reservoir in the United States. The dam measures 21,026 feet long with a maximum height of 250.5 feet. The reservoir is 134 miles long, with 1,520 miles of shoreline, and a maximum depth of 220 feet. Drainage area for the lake is approximately 10,200 square miles. Total storage capacity of the reservoir is approximately 18.7 million acre-feet. Since the construction of the dam, officials and residents of downstream cities have worried about community safety in the event of a catastrophic dam failure.
Dams and their reservoirs provide important benefits, including: hydroelectric production; water storage for consumption, irrigation, downstream flood control and navigation; and recreation. However, along with these benefits, dams pose serious flooding risks for both upstream and downstream river basins, agricultural land, historical sites, wildlife habitats, and urban areas. According to the USACE National Inventory of Dams (NID) there are more than 79,000 functioning dams within the U.S, Puerto Rico and the U.S. Virgin Islands. About 8,100 dams are classified as major dams, which are defined as "50 feet or more in height, and a maximum storage capacity of 25,000 acre-feet or more."
As part of the Pick-Sloan Plan enacted by Congress in 1944, six large multi-purpose dams were constructed by the USACE between 1930 and 1970. All six dams continue to be maintained and operated by the USACE. During the 1980s, the USACE developed a Missouri River Emergency Action Plan (Missouri River EAP) and provided officials of each downstream community with information and maps concerning projected peak flood elevations in the event of a catastrophic dam failure. Projected peak flood elevations were based on the dam at full capacity. Although the 1980’s USACE paper maps were extremely valuable for helping community officials visualize peak flood elevations in the event of a catastrophic dam failure, they did not provide analysis of economic or environmental losses, location of populations at risk, possible evacuation routes or shelters, critical services and critical needs, hazardous/toxic sites within the flood zone, or other data important for emergency preparedness and response planning. In 2008, the Missouri River EAP was updated, but neither the 1980’s nor 2008 maps/data were digital.
The City had been using Esri’s ArcMap software for several years but had not been able to justify the high cost of the license fees for remote sensing software. The iGETT grant provided the opportunity for the local college to receive remote sensing software, the higher-level ArcInfo software, and the training necessary to analyze Landsat, MODIS and ASTER data. iGETT made it possible to convert the information from the Missouri River EAP paper maps into digital format and help City officials update and improve their emergency preparedness and response plans.
The iGETT catastrophic dam failure study ("Study") was done as a community service project by Williston State College faculty, staff and students from seven disciplines who volunteered numerous hours to produce maps and information to help the City. As part of the Study: an advanced GIS student beta-tested the geospatial lesson, collected GPS data and developed digital maps; physics students worked with a hydrologist from the National Resources Conservation Service (NRCS) to analyze the expected impact of flood waters on the local oil wells and storage tanks; biology students analyzed the impact of flood water on local wildlife habitat and farm land; a graphic design student developed imagery to help local officials visualize how high the flood waters would reach on key City buildings; English students researched historic floods in the U.S. and wrote research papers; and speech students developed a PowerPoint presentation and presented the final findings of the Study to City officials at a regular commission meeting. All local officials (city and county commissioners, law enforcement, fire department, ambulance, city engineer, local hospital and medical clinic administrators, etc.) received a booklet containing copies of the reports and maps. During the Study researchers learned that 16 other communities and two federal historical sites located downstream of Fort Peck Dam were also at risk. Each of those entities also received copies of relevant documents and maps.
Materials and Methods
Software used in the Study included Esri’s ArcInfo 9.3, ITT Visual Information Solutions’ (now ITT Exelis) ENVI 4.5, FEMA’s Hazus-MH, and Minnesota Department of Natural Resources’ DNR conversion software for Garmin GPS. Data sources included Esri and local, state and federal government agencies, including: USACE; NASA; USGS; USDA; FEMA; National Land Cover Dataset (NLCD); U. S. Census; North Dakota GIS Hub; North Dakota Oil and Gas; Williston City Engineer; Montana GIS Data Portal. Data included DEMs; NEDs; National Agricultural Imagery Program (NAIP) photographs; DRGs; Landsat 7 imagery; city, county and state boundaries; oil well sites; sewage/waste water plant; potable water plant; agricultural Common Land Units (CLUs); land use land cover (LULC); city parcels; city zoning; data collected by hand-held GPS. All data used were free except the FEMA Q3 data.
Esri’s ArcInfo tools and procedures included: Spatial Analyst; 3D Analyst; Times Tool; Editor; Snapping; ArcScene; Statistics Tool; reclassification; image mosaicking of raster data; clipping of raster data; digitizing; contours; hillshade; shaded relief; closing open vertices; converting closed lines to filled polygons; cutting spatial donut holes; adding data and converting units in attributes tables; overlay; extraction by mask; selection by location and attribute; extrusion and rendering; animation and fly-through; creating graphs and tables; adding graphs and tables to maps; importing Excel data; collecting data with GPS and downloading waypoints into ArcInfo.
ENVI tools and procedures included: Feature Extraction Tool; LizardTech’s MrSID and Digital Elevation Model (DEM) Importation; 2D Surface Tool; GeoTiff Imagery Creation for Importation into ArcScene; QuickMaps; image sub-setting; band stacking and linking images; vector data importation and overlaying on satellite imagery; imagery reprojection; unsupervised K-means and ISODATA classifications; post-classification; transforming classification image into vector polygons; ENVI zoom and feature extraction; adding extracted satellite data to ArcGIS.
Hazus-MH software, designed to estimate direct and indirect social and economic losses, clean-up time and costs, was used without success.
Results (presented as findings/tables/graphs/maps; see below for graphics)
Mean annual river elevation near the City is 1,844 feet. Land elevations near the river measure 1,864 feet. The USACE analyses completed in the 1980s and reviewed in 2008 estimate a peak flood elevation of 1,891 feet for the City (in the event of a catastrophic dam failure, assuming the dam is at full capacity). Estimated time for flood waters to arrive in the City is 33.6 hours with peak flood elevation in 52.8 hours, nearly a 50-foot increase in river elevation in slightly over two days after dam failure.
Estimated:
-
Anticipated depth of flood water near key building and structures:
- Williston State College Crighton Building - 29 feet
- AmTrak Train Depot - 25 feet
- Above the top of Missouri River Levee - 24 feet
- Police/Sheriff Department - 16 feet
- Williston State College Gymnasium - 15 feet
- City potable water plant - 8 feet
- Fire/Ambulance Department - 6 inches
-
Losses based on city parcels’ value:
- Total number of city parcels (March 2010) - 5,868
- Total city parcels predicted lost in catastrophic flood - 3,337
- Percent of city parcels lost in catastrophic flood - 56.87%
- Minimum market value of a city parcel - $0.00
- Maximum market value of a city parcel - $7,137,000.00
- Sum total market value of all city parcels - $481,754,226.00
- Total market value of city parcels lost in catastrophic flood - $287,291,274.00
-
Losses based on city zoning [16 zoning classifications used in Williston, ND, were regrouped into five]:
- Total number of zoned areas (approximate) - 1,268 units
- Class I. 51 unzoned units; 28 units expected to flood - 54.9% lost
- Class II. 149 commercial units; 118 expected to flood - 79.2% lost
- Class III. 153 industrial units; 127 expected to flood - 83.01% lost
- Class IV. 905 residential units; 498 expected to flood - 55.03% lost
- Class V. 10 parks; 6 expected to flood - 60.0% lost
-
Agricultural property impacted/lost [common land units (CLUs), by ownership]:
- Total number of CLUs predicted lost near Williston, ND - 1,402 units
- Total number of CLUs acres lost near Williston, ND - 81,960 acres
- Minimum acres of a CLU within flood zone near Williston, ND - 0.07 acres
- Maximum acres of a CLU within flood zone near Williston, ND - 1,489.78 acres
-
Incalculable losses:
- Human life
- Livestock and domestic animal life
- Wildlife and their habitats
- Environmental and economic impact
- Contamination from hazardous/toxic wastes
- Failure of City waters and sewer systems
Discussion
Worldwide, floods are considered the number one natural hazard, causing more deaths and damage year after year. There are numerous causes of flooding such as extreme storms, higher than normal annual precipitation, earthquakes which cause tsunami waves, and levee or dam failure. FEMA develops Q3 Flood data for all communities within the U.S. at risk for flooding, based on their flood risk assessments. However, FEMA’s Q3 Flood data, commonly used by insurance and banking industries, do not take into consideration catastrophic events such as dam failures.
Dams fail for many reasons including: earthquakes; extreme storms, which cause dams to overtop; structural and age-related problems; terrorism. There are numerous documented dam failures in the U.S., including the Teton Dam in Idaho, which failed in 1976, killing 14 people, and Fort Peck Dam in Montana – the same dam studied in this analysis – which failed during construction in 1938, killing eight people.
Worldwide, one of the worst dam failures occurred in China in 1975, when a severe storm overtopped one dam, resulting in a downstream domino-effect where 60-plus additional dams overtopped, killing an estimated 230,000 people. Approximately 85,000 people died immediately from the flood waves and inundation. The remaining 145,000 died from starvation and disease after the flood waters receded.
Losses resulting from dam failures vary, depending on the height and capacity of the dam, fullness at the time of the collapse, distance from the dam, time of year, time of day, technology available to warn downstream residents, etc. Losses are difficult to calculate in monetary values when they include ecological and environmental damages, pain, suffering, and loss of life. Catastrophic dam failures are rare. However, community leaders have a responsibility to prepare for emergencies of all kinds, including catastrophic events, in order to minimize loss of life and property. It was determined from this Study that geospatial technologies can help community leaders 1) assess potential risks and losses associated with catastrophic events, and 2) develop baseline data for emergency preparedness and response plans.
Future Study
The authors recognize that two at-risk populations were inadvertently missed in this Study:
- The location of home-bound residents who, for various reasons, never or rarely leave their homes. They may receive home-care services such as home-health care and/or Meals on Wheels, etc., but few people in the community see or even know of these secluded individuals. Many of these individuals will need assistance with evacuation.
- In addition, during the past few years there has been a huge influx of people to the City who are employed in local oil production. Because of the lack of housing, many oil field employees live in tents (weather permitting), and vehicles or campers. Others live in “man-camps” developed by the oil companies for their employees. There is a critical need for the City to develop and continually update a database which identifies locations of all home-bound residents, campsites and man-camps to make sure no one is forgotten during an evacuation.
The Need for Higher Resolution Elevation Data
This study was first developed as a classroom exercise to help students learn 1) advanced GIS analysis techniques, and 2) how to integrate remote sensing technology with GIS. The Study was also designed to help the community of Williston, ND address a real-world problem. To keep costs at a minimum for classroom instructors, free data were used wherever possible, including 10 m and 30 m elevation data used to generate the estimated peak flood elevation. The authors acknowledge that generating small elevation contours from 10 m and 30 m elevation data introduces map error. The map error can be used in the classroom as a teaching tool to help students understand sources of error and the importance of assessing map accuracy. However map error resulting from the use of 10 m and 30 m elevation data is not acceptable for City officials with a real-world problem, who need accurate information to make effective decisions to protect lives, property and resources.
The accuracy of the flood maps for the city of Williston would have been greater with higher resolution elevation data such as interferometric synthetic aperture radar (IfSAR) data with 5 m resolution or light detection and ranging (LiDAR) data with 0.5 m resolution. However, neither IfSAR nor LiDAR data have been collected for the Study area. Estimated cost to purchase IfSAR data for the Study area was approximately $100,000. Numerous local, state and federal agencies were contacted in an effort to secure funding to purchase IfSAR elevation data, but without success.
City officials were informed that because only 10 m and 30 m elevation data were available 1) the Study could only provide an estimate, rather than an accurate calculation, of risks and losses in the event of a catastrophic dam failure, and 2) this Study must be reevaluated when IfSAR or LiDAR data become available. Even with the error, City officials were extremely supportive and appreciative of the work done by Williston State College because the Study provided digital baseline data and numerous risk analyses where previously, they had only a paper map.
Students Learned More Than a GIS Lesson
Numerous students, faculty and staff from Williston State College (WSC) volunteered many hours of their time to help develop maps, documents, reports and the presentation for City officials and the 16 other communities at risk. During the semester, the campus was buzzing with excitement. As at every college, WSC faculty schedules are overloaded, yet faculty members allowed students to work on the Study during class time and mentored students as needed. In addition, students voluntarily spent numerous hours outside of class working on the Study. All wanted to know if their homes were in the flood hazard zone. Williston and 16 other communities will be safer with updated community emergency and response plans. WSC experienced first-hand how GIS and remote sensing technologies can help students improve spatial awareness, critical thinking and problem solving skills, collaboration, effective written and oral communication skills, and can foster citizenship, community pride and service.
Closing Comments
The city of Williston, ND is located between two of the largest multi-purpose dams on the Missouri River: Fort Peck Dam, approximately 227 miles upstream, and Garrison Dam, approximately 200 miles downstream. Pool elevations of each reservoir are controlled by the USACE, with year-to-year variations that reflect upstream and downstream needs. The downstream Garrison Dam is generally maintained at a pool elevation which causes the reservoir to extend hundreds of miles upstream, with reservoir backwaters near the City. In the event of a catastrophic failure of the upstream Fort Peck Dam, a relatively low pool elevation of the downstream Garrison Dam would allow more water to pass the City and reduce the risks, while a relatively high pool elevation of the downstream Garrison Dam would put Williston at greater risk.
Important points for City officials: 1) In the event of a catastrophic failure of the upstream Fort Peck Dam, peak flood elevations and resulting damages for the City and surrounding area would be impacted by pool elevations of both reservoirs, not just the upstream Fort Peck Reservoir; 2) The USACE projected peak flood elevation of 1,891 feet assumes Fort Peck Reservoir is at full pool capacity; 3) The 1,891-foot peak flood elevation used in this Study is unlikely to occur because the USACE rarely maintains its dams at full pool capacity. However, full pool capacity can occur from natural conditions. Due to unusually high snow pack in Montana and Wyoming and severe flooding all along the Missouri and Mississippi Rivers, both Fort Peck and Garrison Dams were at full pool capacity for most of the summer in 2011, for the first time in approximately 20 years. This was a rare event, but it was a reminder that unexpectedly high pool elevations are possible, and that they greatly increase the risks for Williston and the surrounding area.
No analyses were performed in this Study on the watersheds involved, flow direction or accumulation, stream network, type of wetlands or modeling of the flooding processes, etc. In addition, no statistical accuracy assessments were done on the elevation contours derived from the 10 m and 30 m elevation data, or the data derived from the contours.
The Study was presented to officials of the Omaha, NE Regional USACE office, the Riverdale, North Dakota USACE office, and the local Williston, ND USACE office during a regional Emergency Planning Meeting, held in Riverdale, ND, March 2010. Following the presentation, the Study received full support by the USACE.
As a final analysis, a Fourier and Lomb normalized periodogram was applied to assess a possible catastrophic failure timeline of Fort Peck Dam by comparing it to historical data of dams that have failed. The analysis determined that the greatest likelihood of failure would have been between 34-46 years after the dam was completed. The threshold of maximum likelihood of failing has been surpassed by Fort Peck dam since it was constructed during the 1930s and is nearly 78 years old.
Other iGETT Lessons
For those interested, nearly 40 iGETT-sponsored geospatial lessons, data and support documents, covering a wide range of topics and levels of difficulty, are available on the iGETT website for free download and use. Lessons include analyses of urban heat islands, agriculture, invasive insects, flooding, drought, land cover changes and assessment, impervious surfaces, wildfire burn assessment, tree canopy assessment, tsunami damage, urban growth, biomass analysis, NDVI analysis, land surface heat emissivity, etc. GIS instructors across the country are using the iGETT lessons in their classrooms, sometimes revising them to use local data.
Important Free Geospatial Data
An important source of geospatial data is Landsat imagery. A recent USGS policy change has made Landsat data available at no cost. Landsat imagery is important geospatial data for land use planning, assessing vegetation health and many other uses, and the entire archive going back to 1972 is available free! An introductory-level tutorial on how to download and open Landsat imagery in the free ImageJ software is available on an individual basis from J. Allen (contact information below).
Acknowledgments
IGETT sponsors: National Science Foundation; National Council for Geographic Education
(NCGE); Del Mar College, Corpus Christi, Texas; U.S. Geological Survey (USGS) Land Remote Sensing Program; Science Systems and Applications, Inc, (SSAI); Sigma Space Corporation; NASA Goddard Space Flight Center; Esri; iTT Visual Information Solutions; Office of the Secretary of the Interior; Leica Geosystems; American Society of Photogrammetry and Remote Sensing (ASPRS)
iGETT Project Director: Osa Brand (NCGE)
iGETT Trainers: Ann Johnson (formerly Esri, currently National Geospatial Technology Center); Jeannie Allen (Sigma Space Corporation at NASA Goddard Space Flight Center); Laura Rocchio (SSAI at NASA GSFC); Richard Irish (formerly SSAI at NASA GSFC); Rachel Headley (USGS)
Williston State College (WSC) students, especially Advanced GIS student, Ron Radle; WSC faculty James Stout (English), Susan Zimmerman (Biology), Lance Olson (Physics), Sher Hakes (Graphic Design), Ken Quamme (Computer Technology), Taryn Sveet (Speech), and Maeve MacSteves (Entrepreneurship); WSC staff, especially Angie March and Aric Thorstad; WSC administration; Terry Olson and WSC Foundation Board of Directors; USACE Natural Resource Manager, Williston Office, Jeff Keller; City Engineers, Monte Meier and Carl Dunn; City GIS Technicians, Kent Hanson and Steve Kemp; City Mayor Ward Koeser
A Special Thank You to the Following!
iGETT Director Osa Brand, and iGETT Trainers Jeannie Allen and Ann Johnson
Contact Information for Additional Introductory-level Exercises and Tutorials for Downloading Landsat Data:
Jeannie Allen, Sigma Space Corporation
Hydrospheric and Biospheric Sciences
NASA Goddard Space Flight Center
US Mail Code 610.9; Org. Code 618
E-mail: Jeannette.E.Allen@nasa.gov
Ofc: 301-614-6627; Cell 301-943-64
Selected Literature and Websites
McCully, Patrick. 2001. Silenced Rivers, the ecology and politics of large dams. Zed Books. New York.
http://cee.engr.uscavis.edu/faculty/lund/dams/Dam_History_Page/failures.
http://www.fema.gov/hazard/damfailure/index.shtm
http://www.geol.ucsb.edu/faculty/sylvester/Teton_Dam/welcome_dam.html
http://www.ecy.wa.gov/programs/wr/dams/failure.html
http://damsafety.org/news/?p=412f29c8-3fd8-4529-b5c9-8d47364c1f3e
http://cee.engr.ucdavis.edu/faculty/lund/dams/Dam_History_Page/Failures.htm
http://simscience.org/cracks/intermediate/failures.html
http://www.sjsu.edu/faculty/watkins/aug1975.htm
http://probeinternational.org/original-content/leading-causes-dam-failure
http://www.readypa.org/potentialemergencies/damfailure/
http://www.disaster-survival-resources.com/dam-failure.html
http://www.fas.org/sgp/crs/homesec/RL33108.pdf
http://www.damsafetycoalition.org/about/101.html
http://igett.delmar.edu
http://crunch.tec.army.mil/nidpublic/webpages/nid.cfm
http://nationalatlas.gov/mld/dams00x.html
Authors: Jacquelin J. Stenehjem1 and Peter G. Oduor2
1Former Assistant Professor, Williston State College, Williston, North Dakota
2Associate Professor of Geology and Geography, North Dakota State University, Fargo, North Dakota
Mrs. Stenehjem is currently a Ph. D. graduate student in Entomology at North Dakota State University, Fargo, ND. Her research involves the use of geospatial technologies with community vector control programs. She is a 2007-2009 participant of the Integrated Geospatial Education and Technology Training (iGETT) project, funded by the National Science Foundation with a 2012 grant to the National Council for Geographic Education, developed to address growing workforce need for geospatially-trained employees able to use remote sensing and geographic information systems, http://igett.delmar.edu/. She is also a 2009 participant of Teachers Teaching Teachers GIS (T3G) Institute, a professional development program designed to train GIS educators to help other educators learn why and how to use GIS in their classrooms, http://edcommunity.esri.com/community/institute2012/index.cfm. Jackie has been an instructor/assistant professor at Williston State College, Williston, ND for the past 18 years in various science/medical and geographic information systems courses. Currently she is on leave to complete her graduate degree.
Dr. Peter G. Oduor conducts research in modeling and simulation of solute/solvent transport, 3D-4D modeling using cutting-edge technology. He currently teaches introductory and advanced GIS, Remote Sensing and World Regional Geography courses at NDSU. He holds a doctorate degree in Geological Engineering from University of Missouri-Rolla (now Missouri University of Science and Technology). He has extensive software developing experience and beta tested several ArcGIS applications. He has secured over $1.8 million dollars in research funding, and has over 50 publications with more than half in peer-reviewed journals and publications.

Study area (click for larger image)
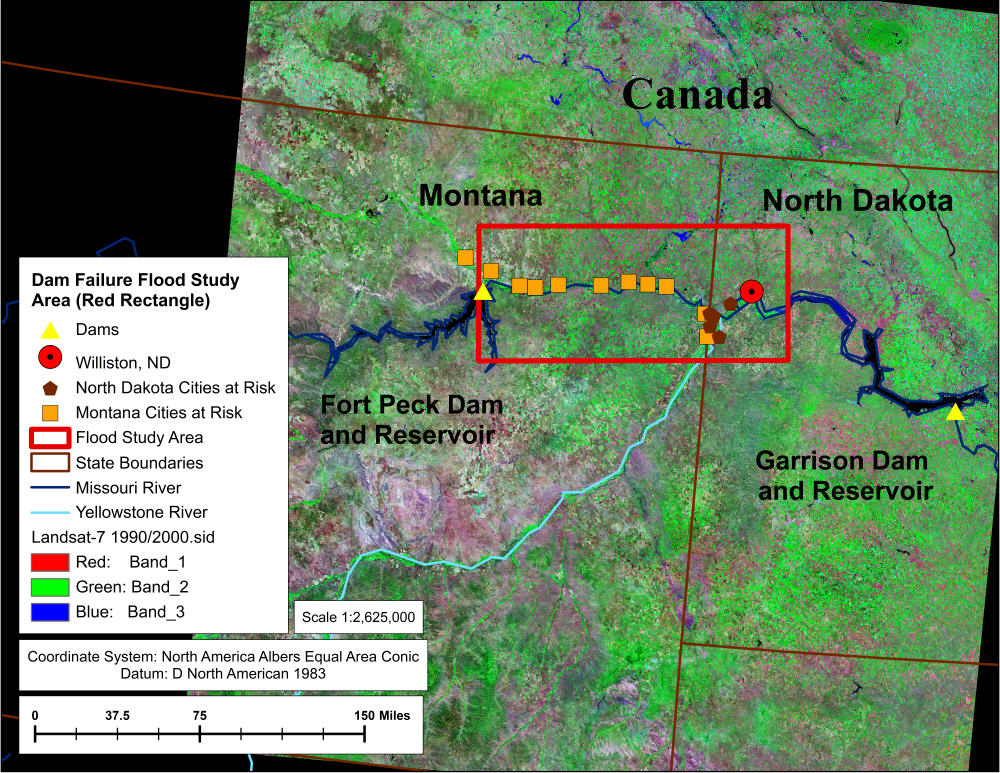
Cities at risk (click for larger image)
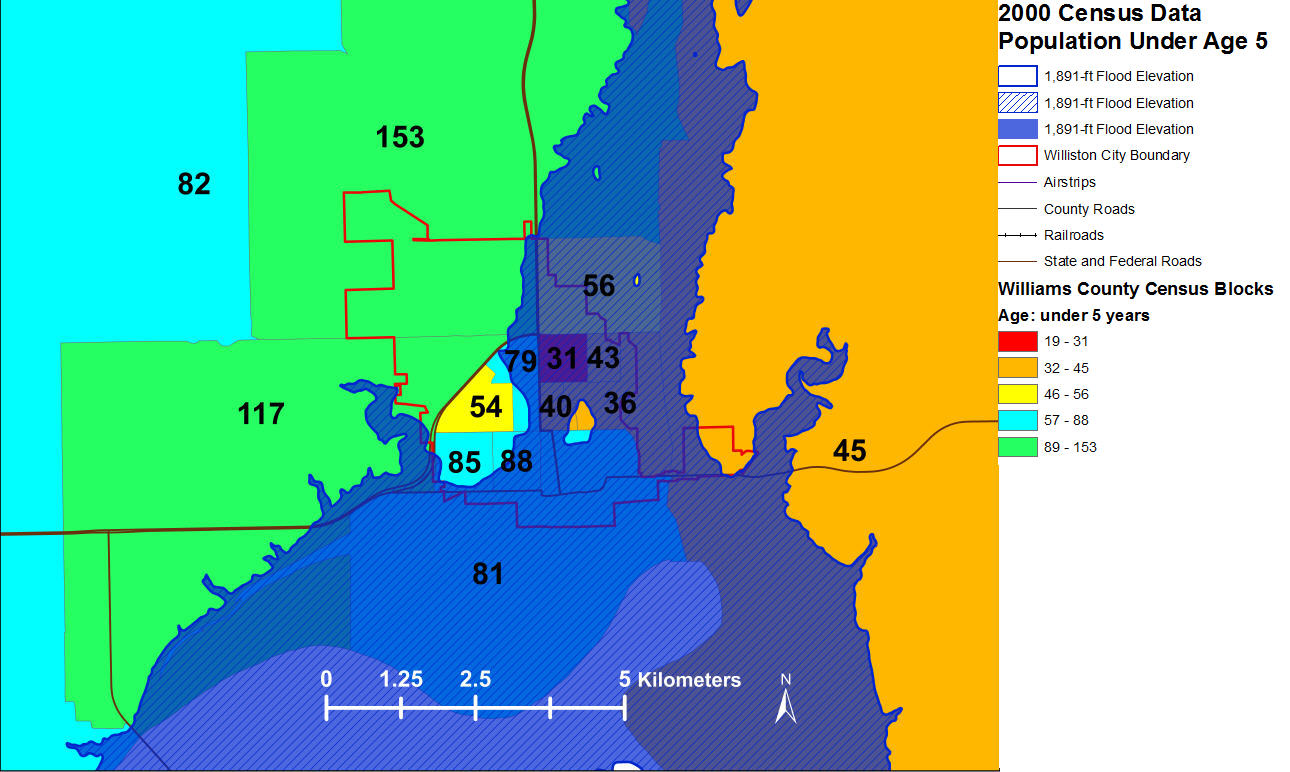
Population at risk <5 years of age (click for larger image)
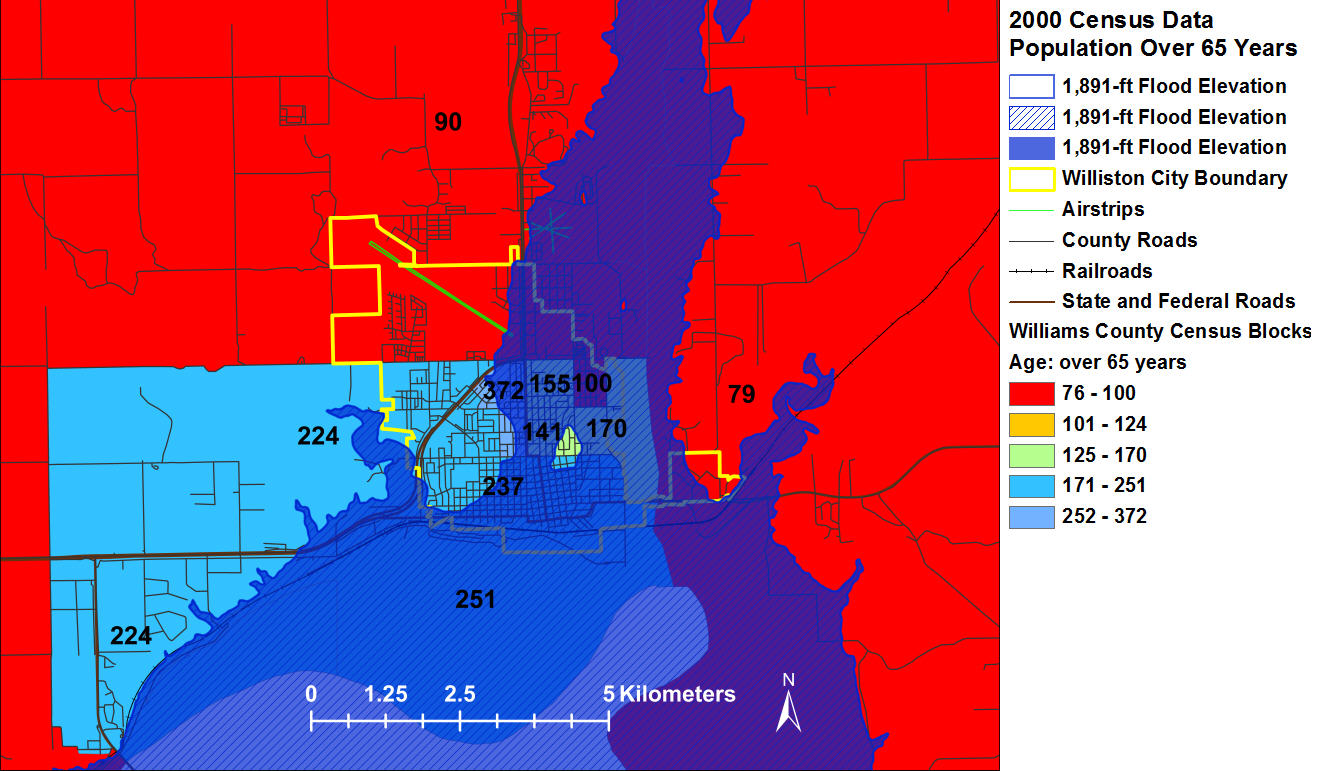
Population at risk >65 years old (click for larger image)
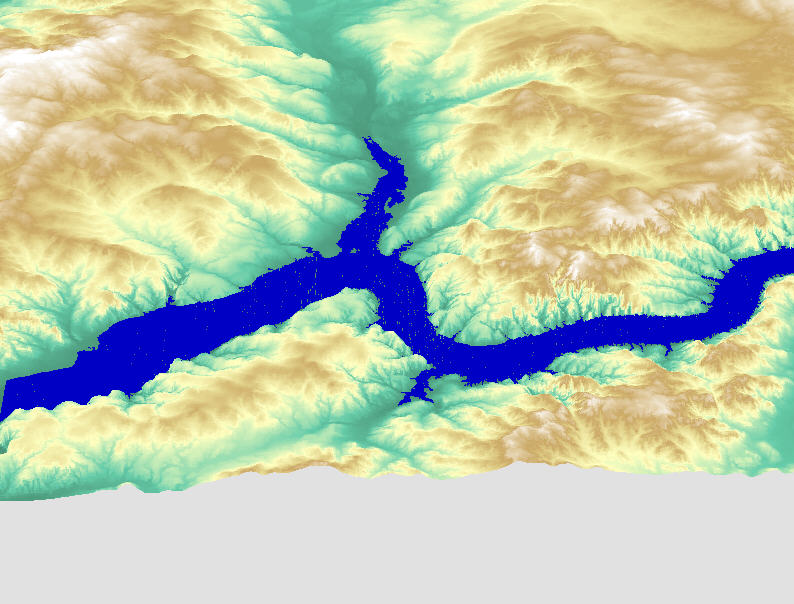
3D Digital Elevation Model (click of larger image)
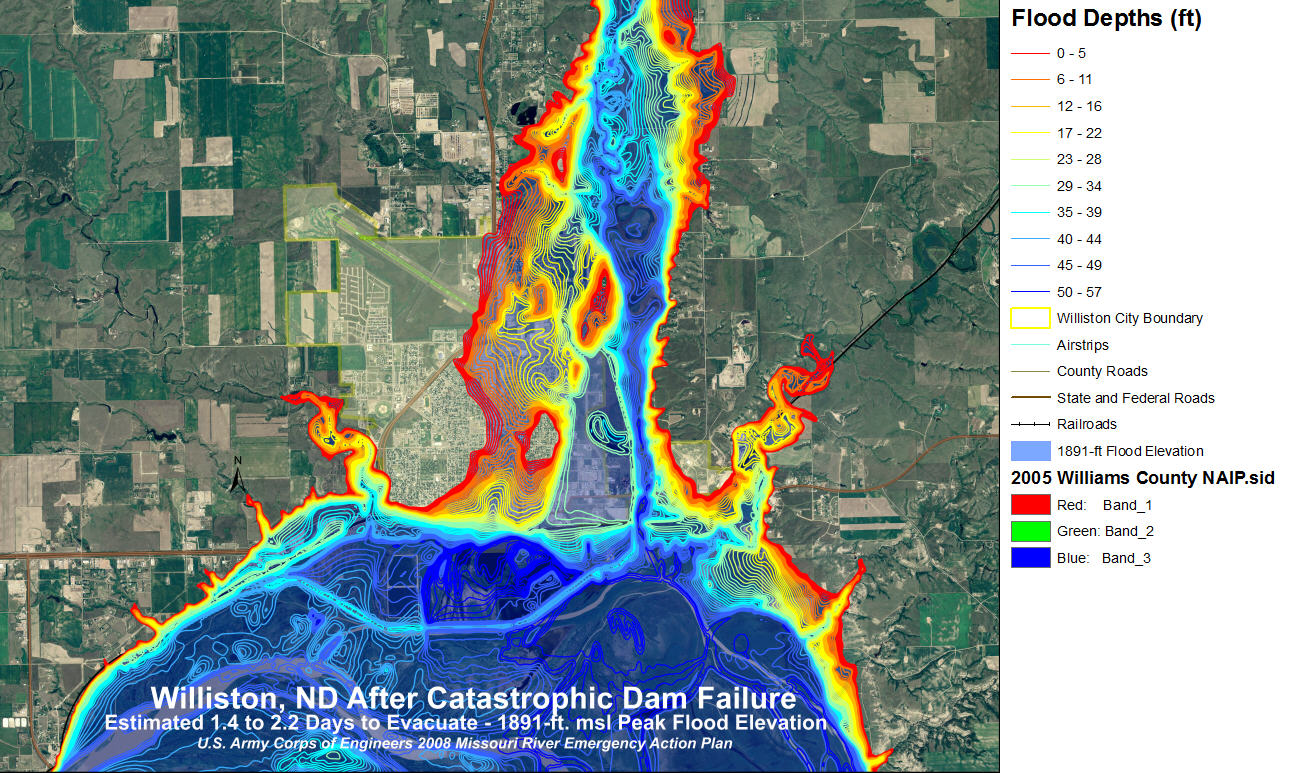
Williston after dam failure (click for larger image)
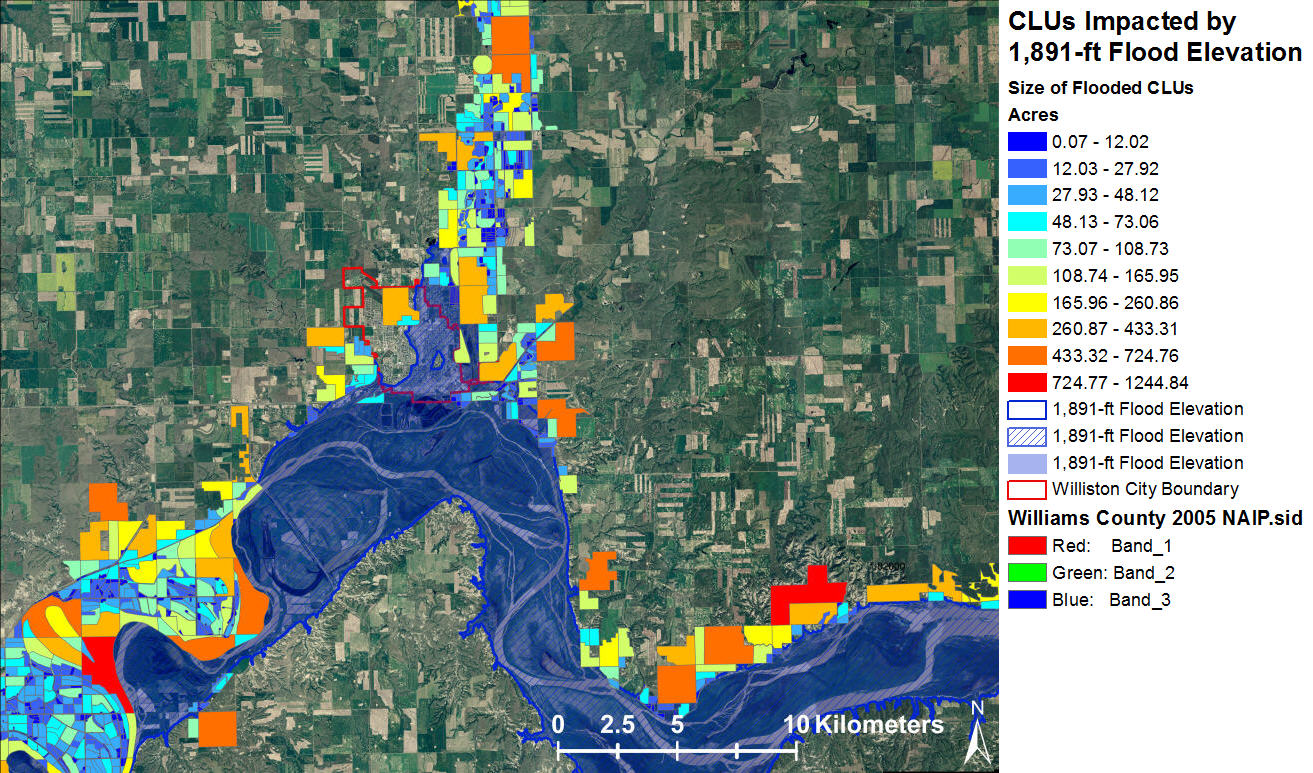
Common Land Units (CLU) impacted (click for larger image)
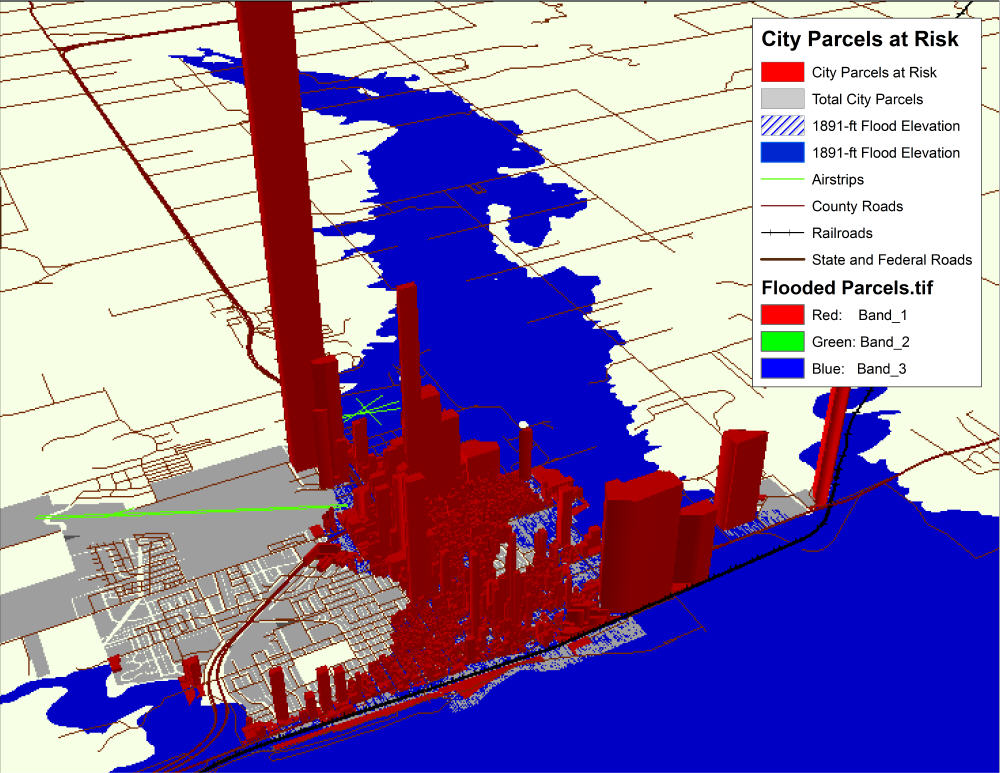
City parcels at risk (click for larger image)
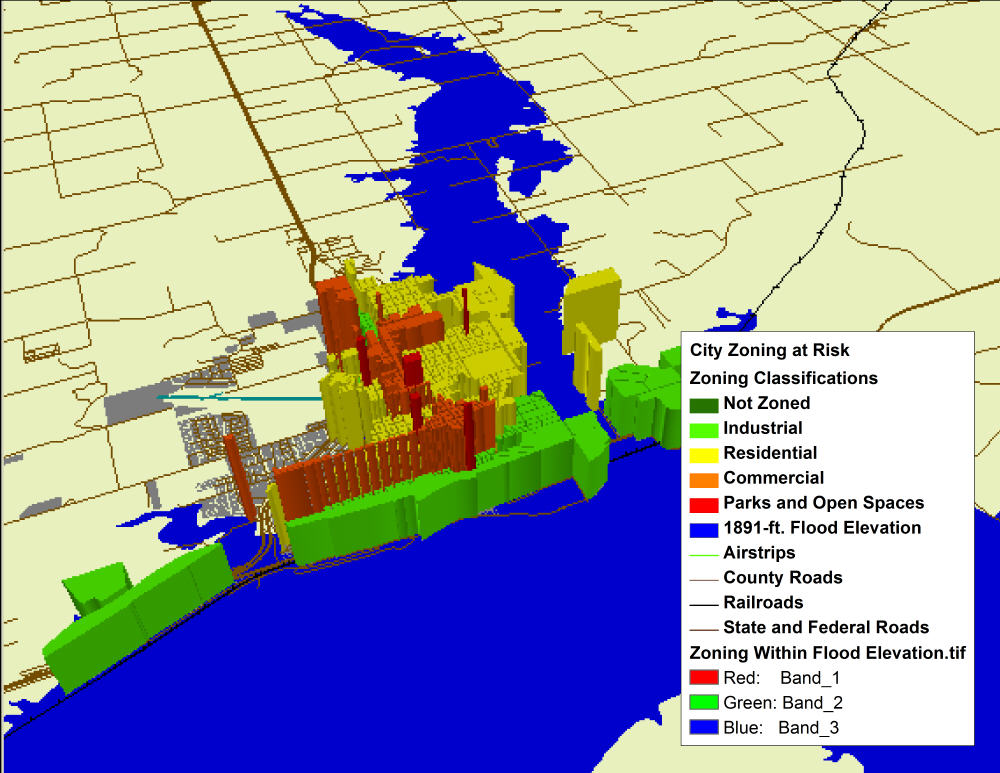
City zoning at risk (click for larger image)
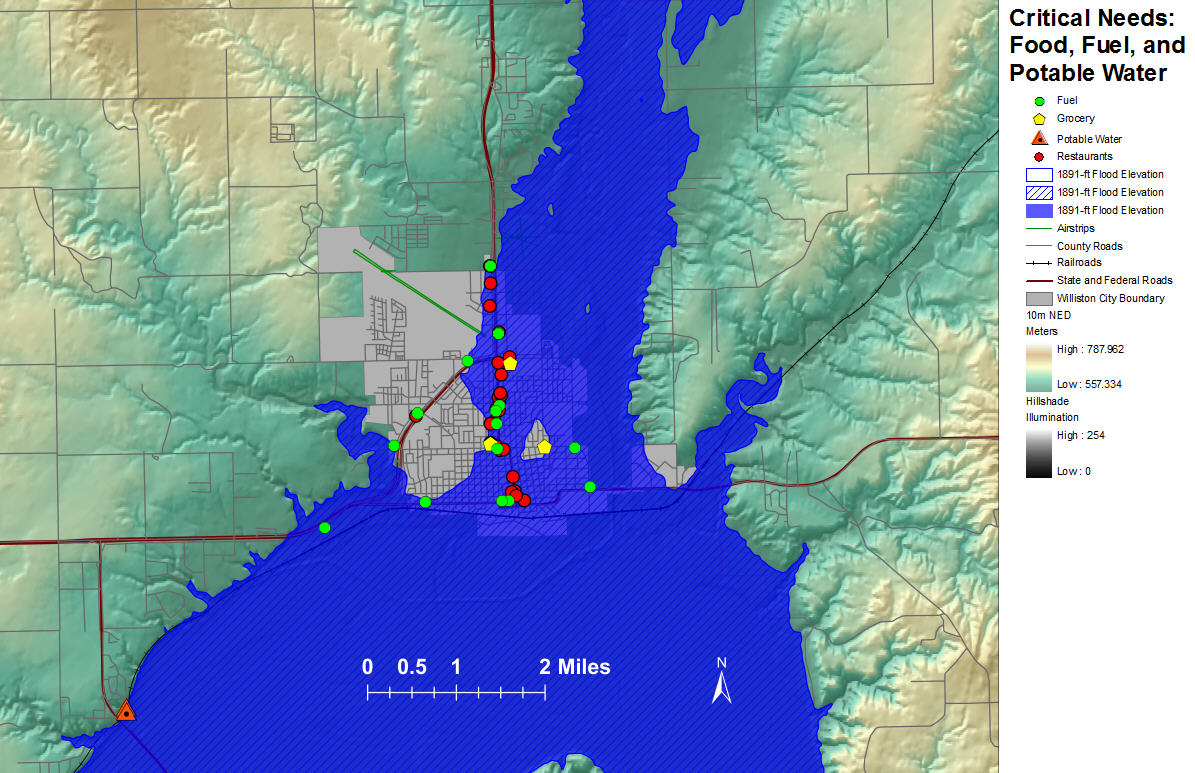
Critical needs (click for larger image)
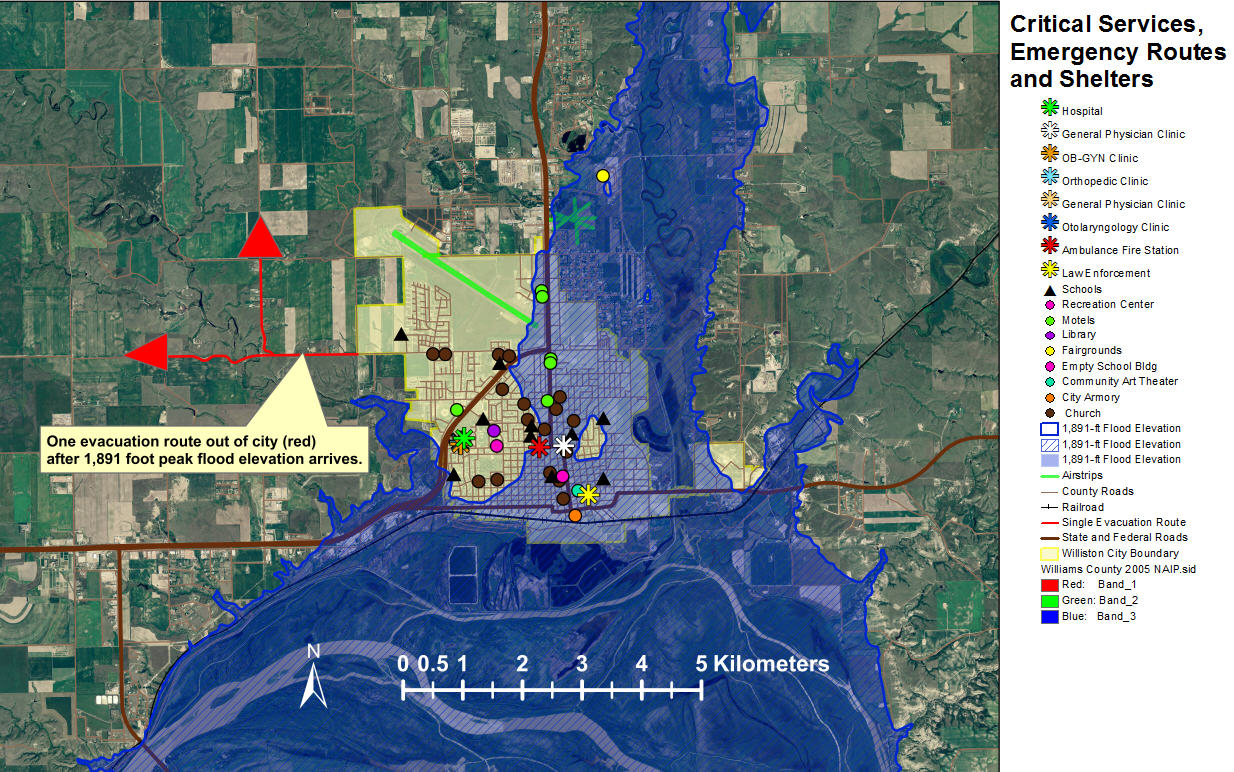
Critical services (click for larger image)
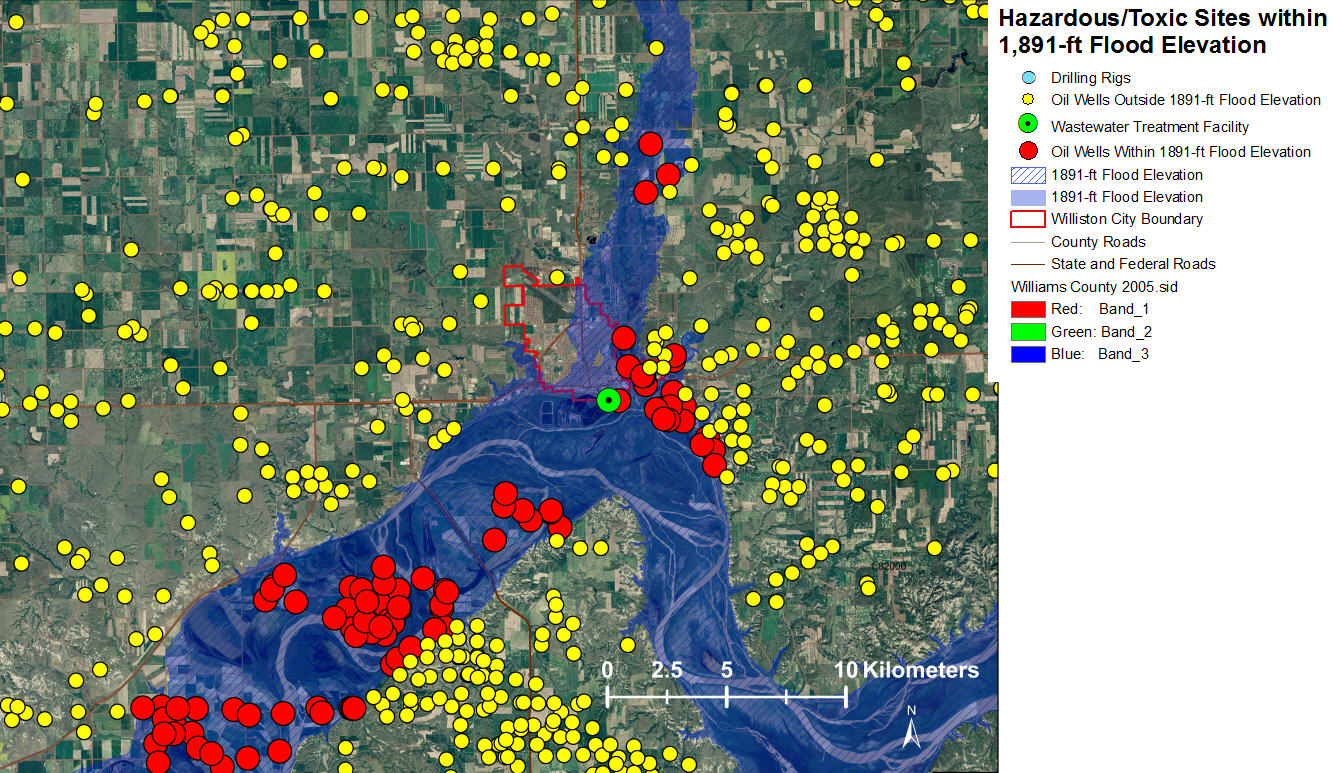
Hazards (click for larger image)
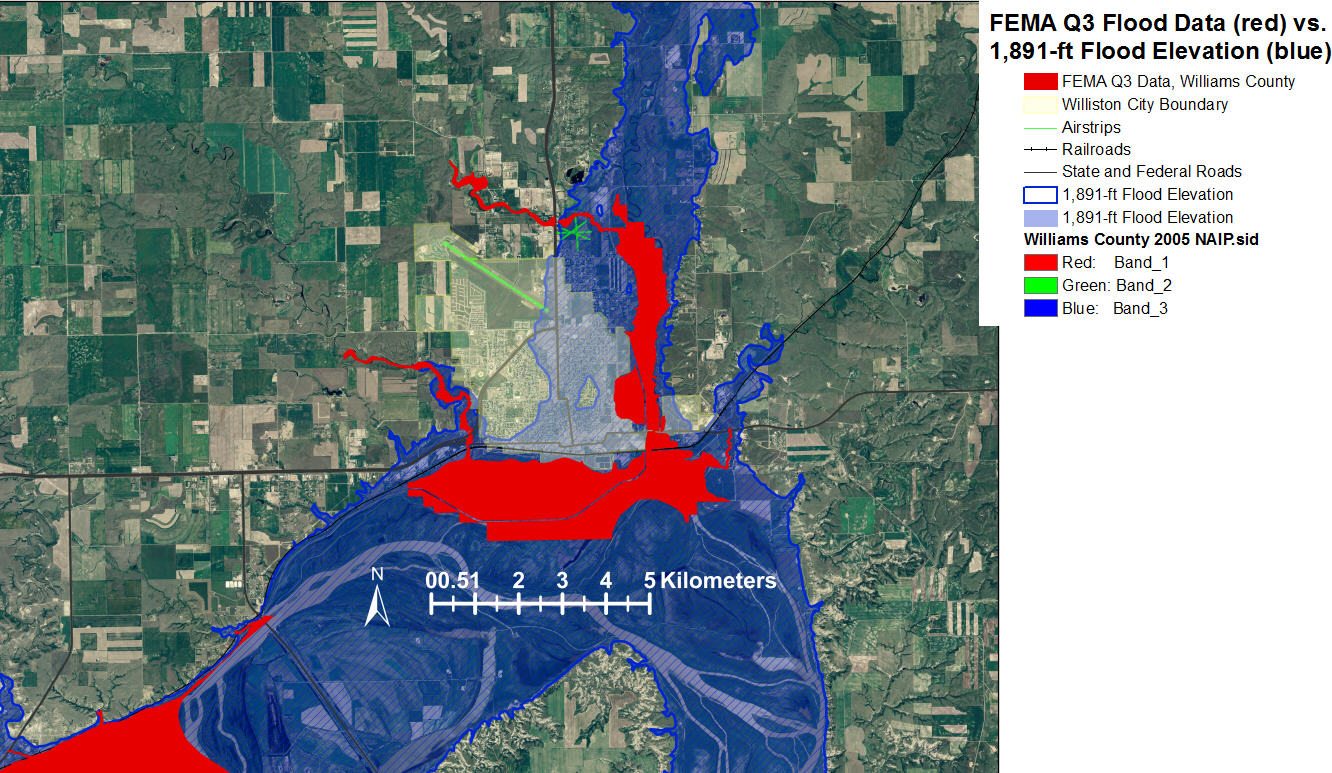
FEMA Q3 flood data (click for larger image)