Situated on the Korean Peninsula, the Republic of Korea (also known as South Korea),
supports a population of more than 48 million people. This small,
densely populated nation continues to expand economically and today
stands as the world's 11th largest trading nation, led by its
shipbuilding industry and the manufacture of electronics,
semiconductors and automobiles.
In 1975, the government formed the Korea Land Corporation (KLC) to acquire, manage and develop land for the government and residents in the country. KLC implemented a GIS in 1990 to support its land management efforts and began collecting and indexing digital geographic information including cadastral, terrain and environmental datasets. The collected datasets subsequently evolved into KLC's spatial data warehouse (SDW), which reduced redundancy and brought to the agency an integrated platform that increased access to the latest available data. In addition, the SDW's common spatial data model and metadata development have improved the quality of the data and helped establish an information-based workflow. The SDW stores more than a terabyte of data and includes the Korea land information system, land suitability assessment, urban planning information system, urban planning statistics system and other datasets used by KLC. The SDW developed by KLC and those databases created and maintained by the Seoul metropolitan government, Daejeon City and other agencies are part of South Korea's national spatial data infrastructure.
In 2006, KLC implemented its Spatial Information Knowledge System (SPINKS). This federated decision-support system is based on ArcGIS Server software, allowing SPINKS to maximize its use of Web GIS capabilities. Oracle 10g R2 is used as the relational database management system. SPINKS was primarily implemented to support sustainable development and balanced land management throughout the country such as land planning, management of land reserves, analysis of its land compensation program and development of new residential and commercial districts. It enables staff members throughout KLC to access spatial data, use the powerful geoprocessing tools available in ArcGIS Server for analysis, and help develop and support KLC's land-use policies.
SPINKS manages more than 125 layers of geographic data found in KLC's spatial data warehouse. The data is provided via the Web to more than 400 employees located throughout the country. Access to the data and related applications is determined by the nature of an employee's work. Some use the system to simply view data, while others perform complex analyses. The powerful, easy-to-use applications were built using Microsoft's .NET platform and the C# programming language to make the system readily accessible to all users. This has lowered the learning curve and training costs, and helped increase the efficiency of the people using the system.
South Koreans are city dwellers; more than 50 percent of the country's residents live in Seoul, the nation's capital, and its surrounding suburbs. Because of the continuing need to review urban housing initiatives, KLC began the implementation of SPINKS in this region. Today, it is used throughout the entire country.
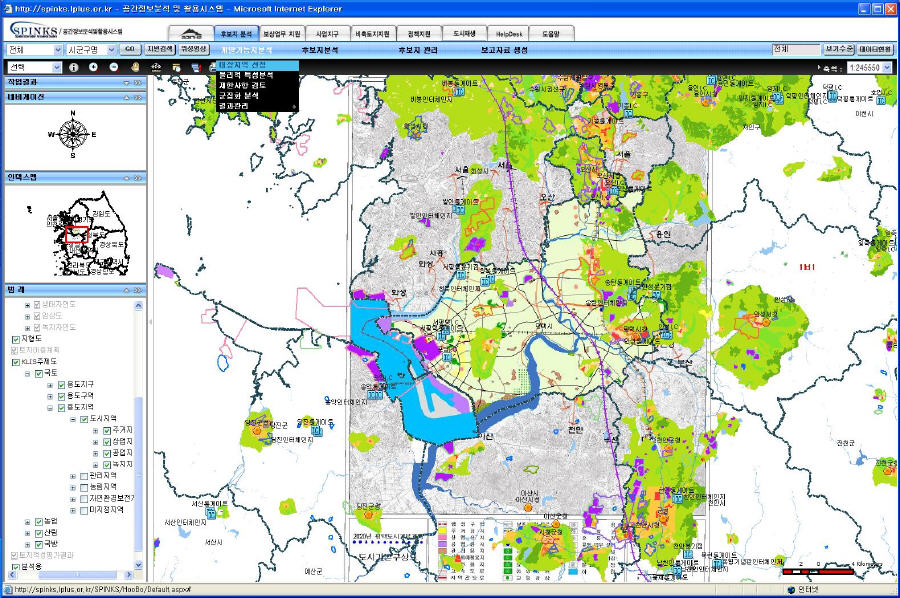
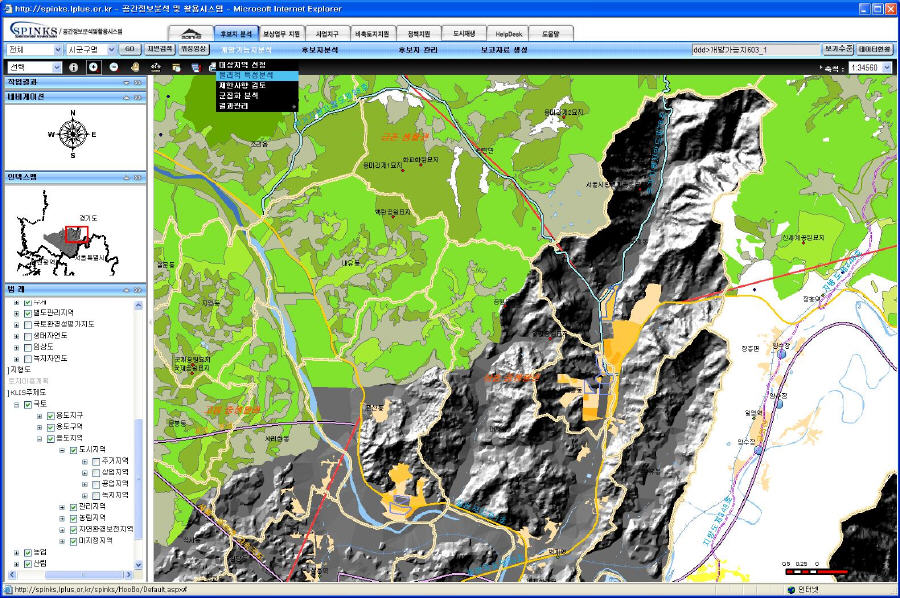
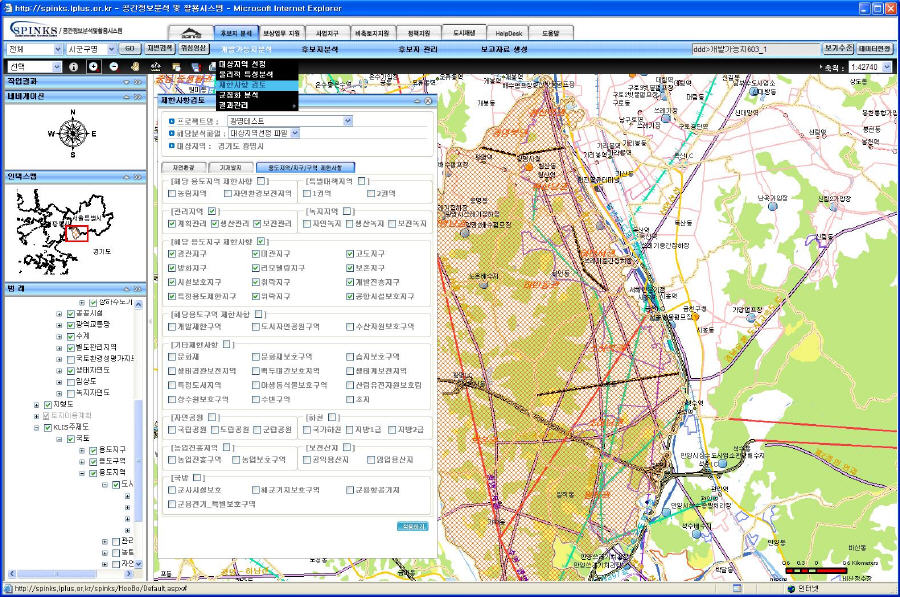
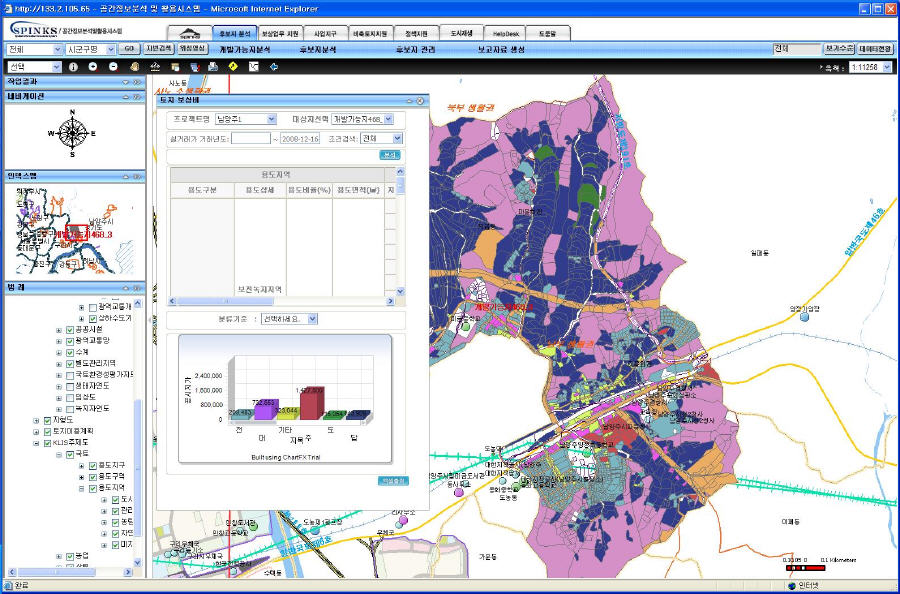
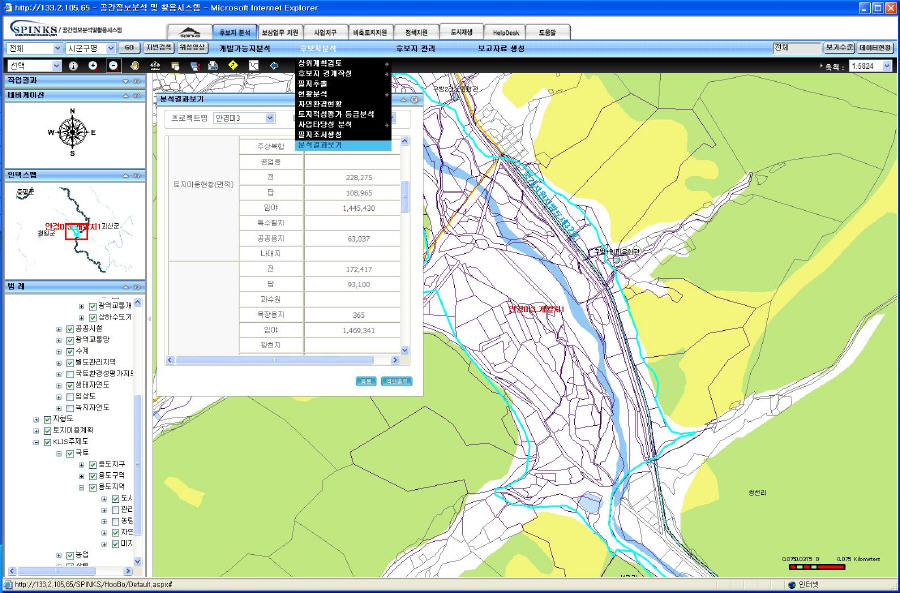
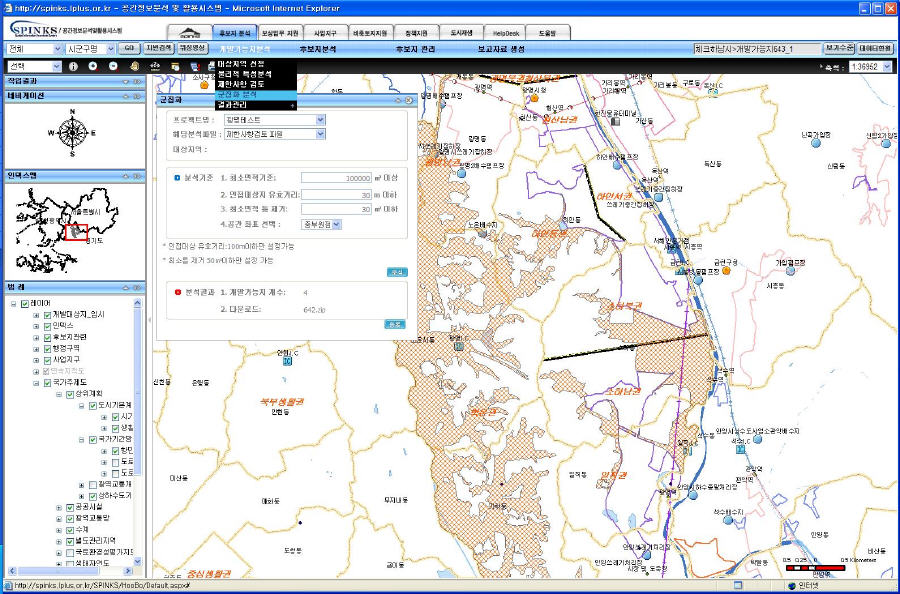
A key function of SPINKS is the evaluation of land for potential housing projects. The process also includes land acquisition and the determination of compensation to be made to landowners for purchasing their land. Forty staff members use the system to analyze potential sites for land acquisition. After selecting a land area from the administration data, which includes city, county and district boundaries, a digital elevation model (DEM) is included to determine if the specified area is suitable for development. Areas meeting the geographic requirements such as slope specifications are then saved in the SPINKS system for further processing. Thematic geographic layers (including protected habitats, rivers and streams, roadway networks, local utilities, hazardous materials and regulations) are overlaid with the specified area to further determine its suitability for development.
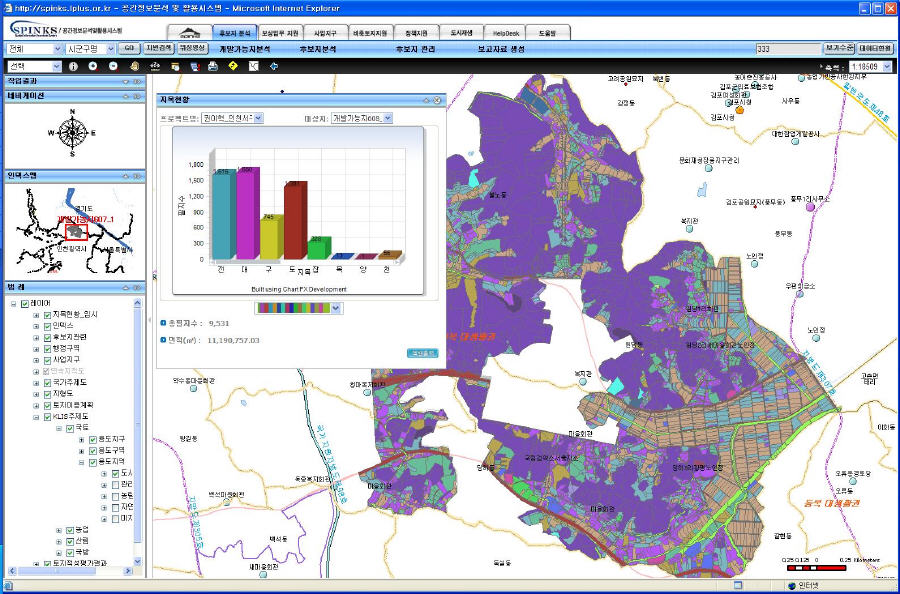
The results of the analysis are then published, and staff members can download them for additional processing. Acceptable areas are designated as development reserved lands. If a specified area includes enough land for housing development, staff will analyze the individual parcels included in the designated location. This includes soil composition, land value, environmental regulations and traffic analysis. If the parcel is determined to be suitable for housing development, KLC purchases the land from its owner. SPINKS also facilitates this part of the land acquisition procedure.
The steps involved in compensating landowners for these acquisitions include basic research planning; publishing land-use maps; extracting the asset designation number(s) and verifying its correspondence with land records; writing papers including official land details; issuing official papers to proceed; separating project areas; land surveying; surveying for obstacles; and compensation examination. Prior to the implementation of SPINKS, this extensive procedure took more than three months. Today, the entire process takes less than a week.
Dr. Yong-Bum Lee, head of the team for the Land and Urban Information Office at KLC, comments, "Integrating SPINKS into the KLC workflow process allows detailed information for any specified site to be quickly accessed. SPINKS makes it possible to easily find the features of a site such as the type of ownership, total value and accessibility to neighboring cities. Before implementing SPINKS, it could take our GIS specialists months to complete the process, depending on the complexity of the project they were working on. SPINKS makes it possible for any staff member to perform this work in only a few days."
In 1975, the government formed the Korea Land Corporation (KLC) to acquire, manage and develop land for the government and residents in the country. KLC implemented a GIS in 1990 to support its land management efforts and began collecting and indexing digital geographic information including cadastral, terrain and environmental datasets. The collected datasets subsequently evolved into KLC's spatial data warehouse (SDW), which reduced redundancy and brought to the agency an integrated platform that increased access to the latest available data. In addition, the SDW's common spatial data model and metadata development have improved the quality of the data and helped establish an information-based workflow. The SDW stores more than a terabyte of data and includes the Korea land information system, land suitability assessment, urban planning information system, urban planning statistics system and other datasets used by KLC. The SDW developed by KLC and those databases created and maintained by the Seoul metropolitan government, Daejeon City and other agencies are part of South Korea's national spatial data infrastructure.
In 2006, KLC implemented its Spatial Information Knowledge System (SPINKS). This federated decision-support system is based on ArcGIS Server software, allowing SPINKS to maximize its use of Web GIS capabilities. Oracle 10g R2 is used as the relational database management system. SPINKS was primarily implemented to support sustainable development and balanced land management throughout the country such as land planning, management of land reserves, analysis of its land compensation program and development of new residential and commercial districts. It enables staff members throughout KLC to access spatial data, use the powerful geoprocessing tools available in ArcGIS Server for analysis, and help develop and support KLC's land-use policies.
SPINKS manages more than 125 layers of geographic data found in KLC's spatial data warehouse. The data is provided via the Web to more than 400 employees located throughout the country. Access to the data and related applications is determined by the nature of an employee's work. Some use the system to simply view data, while others perform complex analyses. The powerful, easy-to-use applications were built using Microsoft's .NET platform and the C# programming language to make the system readily accessible to all users. This has lowered the learning curve and training costs, and helped increase the efficiency of the people using the system.
South Koreans are city dwellers; more than 50 percent of the country's residents live in Seoul, the nation's capital, and its surrounding suburbs. Because of the continuing need to review urban housing initiatives, KLC began the implementation of SPINKS in this region. Today, it is used throughout the entire country.
A key function of SPINKS is the evaluation of land for potential housing projects. The process also includes land acquisition and the determination of compensation to be made to landowners for purchasing their land. Forty staff members use the system to analyze potential sites for land acquisition. After selecting a land area from the administration data, which includes city, county and district boundaries, a digital elevation model (DEM) is included to determine if the specified area is suitable for development. Areas meeting the geographic requirements such as slope specifications are then saved in the SPINKS system for further processing. Thematic geographic layers (including protected habitats, rivers and streams, roadway networks, local utilities, hazardous materials and regulations) are overlaid with the specified area to further determine its suitability for development.
The results of the analysis are then published, and staff members can download them for additional processing. Acceptable areas are designated as development reserved lands. If a specified area includes enough land for housing development, staff will analyze the individual parcels included in the designated location. This includes soil composition, land value, environmental regulations and traffic analysis. If the parcel is determined to be suitable for housing development, KLC purchases the land from its owner. SPINKS also facilitates this part of the land acquisition procedure.
The steps involved in compensating landowners for these acquisitions include basic research planning; publishing land-use maps; extracting the asset designation number(s) and verifying its correspondence with land records; writing papers including official land details; issuing official papers to proceed; separating project areas; land surveying; surveying for obstacles; and compensation examination. Prior to the implementation of SPINKS, this extensive procedure took more than three months. Today, the entire process takes less than a week.
Dr. Yong-Bum Lee, head of the team for the Land and Urban Information Office at KLC, comments, "Integrating SPINKS into the KLC workflow process allows detailed information for any specified site to be quickly accessed. SPINKS makes it possible to easily find the features of a site such as the type of ownership, total value and accessibility to neighboring cities. Before implementing SPINKS, it could take our GIS specialists months to complete the process, depending on the complexity of the project they were working on. SPINKS makes it possible for any staff member to perform this work in only a few days."
 |
 |
 |
 |
 |
 |
 |
From Our Homepage
Saying Farewell to an Amazing Journey
Communicating with Maps
Is There a GIS Career Ladder?
What does it mean to be geospatially smart? Series
Ways Real Estate and Property Developers Utilize Melissa GeoData for Data-Driven Decisions
Unlocking Value From Daily Satellite Imagery and Insights
Maximizing the Value of Your Address Data with Geo Addressing
How Indoor Mapping Enhances the Security of Smart Buildings
Look Ahead: AI, Location Intelligence and Efficiency
Collaboration Takes on Sea Level Rise & Dynamic Technology Environments
Brownies for Brownfields
Has Everything Been Mapped Already?
How Is Data Literacy Changing in an Artificial Intelligence Landscape
Portfolios for GIS Professionals: More Than Just Maps
How to Create a Distance Matrix in QGIS - A Step-by-Step Guide
7 Ideas for Bringing GIS into the K-12 Classroom
The Geography of Movement