 Vendor
ESRI, Inc.
380 New York Street,
Redlands, CA 92373
Tel: 1-800-970-0033
http://www.esri.com
$349.95
Disclosure: Hal Reid has performed several consulting engagements relating to ESRI's BusinessMAP.
Introduction
I have previously written several reviews of BusinessMap (BM 4.0, BM 3.5 and BM Travel Edition 2.0). A common feature of all the versions of BusinessMap is that they have always been bundled with a robust dataset and have been easy to use. However, this version puts BusinessMap in a new league; it is now a full-featured business product. It has a more polished look throughout, including new dialogs, menus and toolbars.
Key new features, followed by descriptions, include:
- Spatial Calculator - add, subtract, multiply and divide geographies
- Find Similar - find ZIP Codes with demographics similar to those where retail outlets are performing well
- Spider Diagrams - show "desire lines" from customers to stores
- On-Map Charting - put charts right on your maps
- Label Manager - similar to what you would find in your word processing software
- Expanded geocoding for databases that contain state, census tract or block groups
- PDF output - e-mail map PDF files or save in other formats
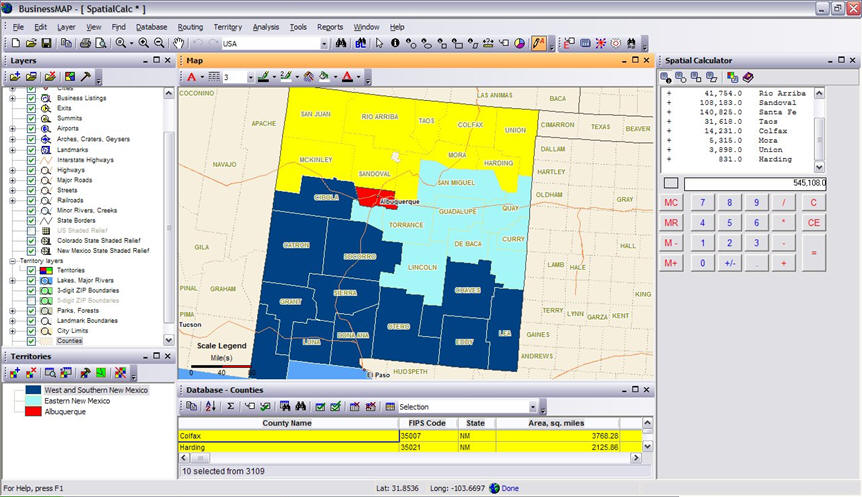
The Spatial Calculator
This feature is unique to BusinessMap, and is one of those features that makes you say to yourself, "Why didn't I think of that?" Clicking on geographies to add to a selection set is second nature when creating territories. The challenge is to try to balance the territories based on some value such as population, number of customers, etc. The Spatial Calculator uses a wizard to help you do that, and in addition, you can apply mathematical functions to the value you are using which will, for example, allow you to simulate growth.
 |
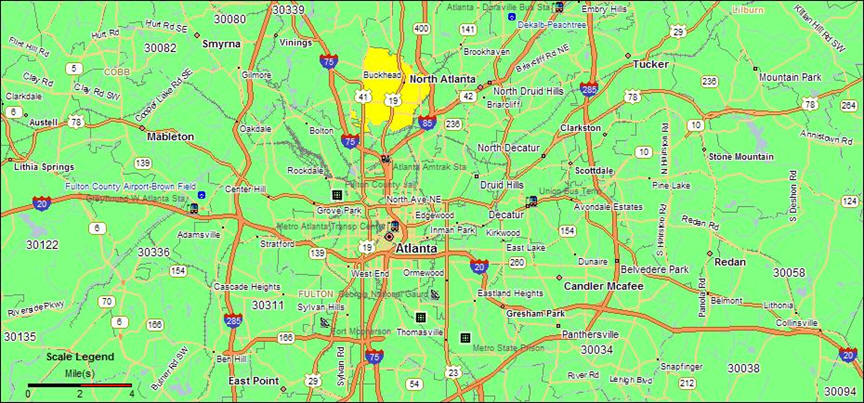
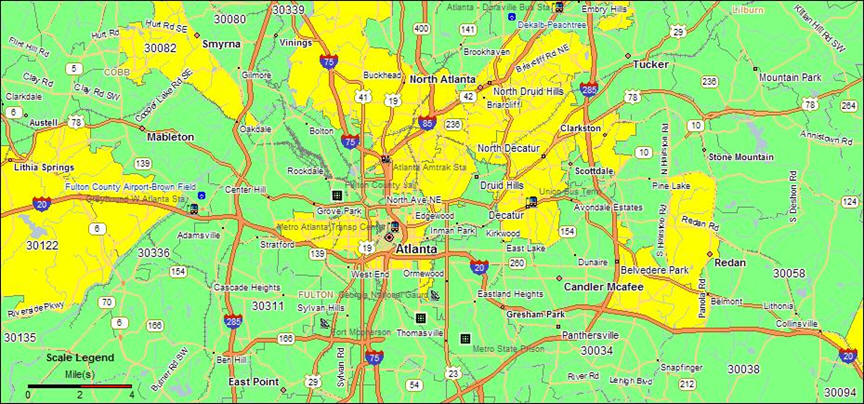
Find Similar
This feature is extremely useful in site selection exercises - it helps you find ZIP Codes that are similar to those in which well-performing retail outlets are located. In my Find Similar example, figures 2 and 3, I have located a ZIP Code in Atlanta that contains a very successful hypothetical store. Since the characteristics of this ZIP Code work well for my existing store, I want to find others like it, for expansion planning purposes. Here is my base map identifying my high performing ZIP Code, 30305.
 |
 |
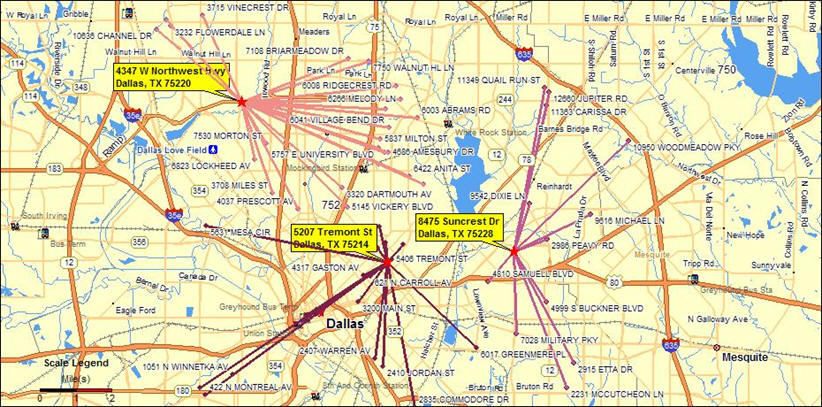
Spider Diagrams
In retail analysis, you are always trying to tie existing customers to the point of purchase, so you can understand both the extent of your trade area and where you are leaving business on the table. There are a number of techniques you can use to show a trade area, but one of the most visually interesting is the Spider Diagram. The Spider Diagram shows lines from the store to the customer's home.
To test the Spider Diagram capability, I split up a database that is part of the sample data in BusinessMap into three parts (Spider 1, 2 and 3). Then I identified a store location for each of the three databases. I stepped through the wizard for each database and created this map.
 |
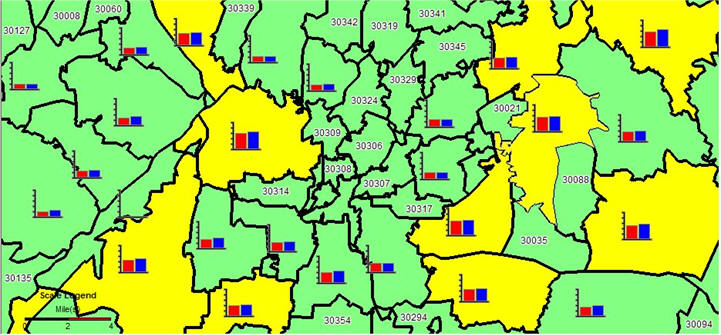
On-Map Charts
If you use the Find Similar capability to identify several ZIP Codes you want to analyze more closely, you might want to compare their characteristics. Displaying a chart of desired characteristics right on the map that shows ZIP Codes of interest can be a good start. To try this out, I used the same map of Atlanta that I had used in Find Similar to look at population and population growth in those ZIP Codes of interest.
Using the wizard, I got a map with charts. After placing the charts, I used the selection tool to highlight the ZIP Codes with the highest population for both 2006 and 2011, as shown in Figure 5. (To make the ZIP Codes and charts clearly visible, I turned off the other map layers.)
 |
Label Manager
This is a basic tool that will let you select the geography to be labeled and modify the font. While this is a very simple feature, it is a very smart way to deal with labels.
Output to a PDF (and more)
BusinessMap creates outstanding presentation-quality maps. Using the PDF output capability, you can select the format you want (including EPS), and/or send maps to e-mail addresses. PDF Creator is a free option when you install BusinessMap (sample PDF output).
Summary
BusinessMap continues to offer great value for businesses. In this version the addition of features like Find Similar, the Spatial Calculator and Spider Diagrams has set it apart from its competitors in this price range. No other product offers the Spatial Calculator. The map output continues to be outstanding, as is the ease of use, especially with the embedded wizards. If you are creating territories, prioritizing markets or looking for sites, BusinessMap is a great tool.
From Our Homepage
Saying Farewell to an Amazing Journey
Communicating with Maps
Is There a GIS Career Ladder?
What does it mean to be geospatially smart? Series
Ways Real Estate and Property Developers Utilize Melissa GeoData for Data-Driven Decisions
Unlocking Value From Daily Satellite Imagery and Insights
Maximizing the Value of Your Address Data with Geo Addressing
How Indoor Mapping Enhances the Security of Smart Buildings
Look Ahead: AI, Location Intelligence and Efficiency
Collaboration Takes on Sea Level Rise & Dynamic Technology Environments
Brownies for Brownfields
Has Everything Been Mapped Already?
How Is Data Literacy Changing in an Artificial Intelligence Landscape
Portfolios for GIS Professionals: More Than Just Maps
How to Create a Distance Matrix in QGIS - A Step-by-Step Guide
7 Ideas for Bringing GIS into the K-12 Classroom
The Geography of Movement