A few weeks ago, I was invited to speak about GIS, but not to address the "usual" crowd.I was invited to participate in learning workshop for the National Infrastructure for Community Statistics (NICS).It's a group, based out of the Brookings Institution, working on creating an infrastructure ("plumbing") to enable better access and use of statistical data for multiple topics (e.g., health, economy, environment) and from multiple sources (e.g., federal, state, local).The workshop was the fourth in a series aimed at learning about "what's out there," the needs of potential users and to start thinking about how potential partner organizations can prepare to participate in a sort of "Web of statistics."
The group assembled was referred to as a "community of practice." I'd heard the term before, but somehow it didn't stick that it's simply a group that's interested in the same thing.In this case, that "thing" is better use of statistics.Troy Anderson of the Fannie Mae Foundation introduced the vision for NICS via an analogy to stock market data.Before 1993, he noted, if you wanted to know the price of say Sprint stock, you could look it up using its stock symbol FON in the tables in the Wall Street Journal.In 1993 StockMaster came online.An MIT project, it essentially grabbed all of this public data and made it easier to find and use.Today, of course, you can get all sorts of free stock data, free analysis and if you like, expensive reports and services.The availability of the data online also enabled online stock trading, changed the roles of traditional stock brokers and launched whole new businesses.The key parallels to the situation with statistics are that (1) the data are out there, they are just hard to get and (2) the infrastructure has to be built to distribute them.
This workshop highlighted national non-profit in sharing statistics and looked at commercial organizations.Several non-profits "told their stories" of how they made their data available to those who needed it.
 |
Anderson introduced his work at Fannie Mae Foundation on KnowledgePlex, a portal for those involved in affordable housing and community development.The idea was to provide access to focused information for practitioners in the field.It made accessing data far easier that using say, Google.The underlying technology (open source) has since been implemented to serve other communities including the National Affordable Housing Management Association (NAHMA), The Arthur Ashe Institute and others.From a technology standpoint, Troy noted the solution "is easy to use, but not easy to build." I appreciated that comment, because it focused the goal of the end user, not the developer.
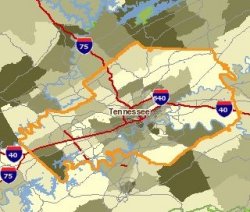
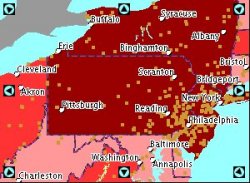
A new project currently in beta from Fannie Mae aims to provide local data for decision makers in housing issues.It's called DataPlace and has as its goal the "democratization" of data.So, not only is data available, but help in applying it is available, as well.I had a great time playing with this site which includes quite a number of maps!
 |
John Balbus of Environmental Defense (ED) provided a tour of that organization's Scorecard.org, a comprehensive website of federal government environmental data.The site has been up since 1998 and still does the job.One challenge, Balbus noted, was that while grants got it started, they've run out, which may cause some changes.(Foundations like to start things, it was mentioned, but not necessarily keep them going.) Despite its good work in trying to provide statistics and detailed data on pollution sources and regulatory definitions, ED regularly receives calls saying "it got the data wrong." On the other hand, it also received calls such as "thanks, we [Dow Chemical, for example] didn't know about that situation! We better fix it!" Balbus also noted that users want even more data: they want local environmental data, they want to be able to download more data, they want to analyze historical trends.The best news about the portal was that its existence has reshaped how the government is delivering its data.
Ben Schniederman of the University of Maryland provided insight into his work on how best to convey statistics.He works on interfaces and tries to measure "what works and what does not." He puts it very simply: "You should be able to find what you need and understand what you find." He noted more than a few challenges.For example, if each state recreation organization uses a different way to offer its listings of parks and beaches, there's no simple way to query across all of them.Further, these individual efforts suggest that all fifty spent money to "re-invent the wheel."
The other fellow who spoke was Robert O'Harrow of the Washington Post.His book, No Place to Hide was published recently and details the "marriage" between the government and private industry in using personal data.(The ChoicePoint data release story broke the day he spoke and he's been interviewed about it many times since then.) While the discussion and questions covered quite a lot of ground, the story that stuck with me had to do with treatment one might receive at a bank, depending on what sort of customer one was, which could be drawn from customer relationship management (CRM) data.If one had a lot of money in a low interest account, you might be treated like a king.If on the other hand, you move your money around, get higher interest rates and basically "make the bank less profit" you may well find yourself waiting in line for some time.
In the afternoon we broke into groups to document challenges regarding small area statistical data access and use, and to suggest possible tools and methods to overcome them.I was pleased that several people in my group raised geospatial issues - like knowing what level of geography to use or how to accurately compare data from different levels of geography.One idea that gained traction was to provide a list of common mistakes, that is, "here are examples of how not to use this data."
I find the concept of NICS quite interesting.It's got some parallels to NSDI and certainly has a spatial component.The participation of non-profits, foundations, academia and local through federal government players gives it a different sort of flavor than other efforts with which I've been involved.I suspect that NICS may learn quite a bit from the work toward data sharing in geospatial areas and that the geospatial community may learn quite a bit from the NICS' approach.
To learn more about NICS, please contact me and I'll get you in touch with the organizers.