| Requirements |
| Pentium-based PC (Pentium II or III recommended) running Windows NT, 2000, 95 or 98. |
| A minimum display size of 800x600 SVGA resolution is needed, although 1024 x 768 or more with 64,000 colors is recommended. |
| Requires a minimum of 16MB RAM, but 32 or greater is recommended. |
| Program requires 75MB hard disk space. Hard disk requirements for data will depend on individual projects. |
| Mouse required. |
Synopsis and Recommendations
The Idrisi software provides a wealth of analytical capabilities at an exceptional price. It also contains extensive import and export procedures and a simple way to interface with other GIS software. These two things make it a direct competitor of raster and statistical analysis functions offered as add-on modules in many other GIS products.Idrisi is a strong candidate to supplement your main GIS with image and raster analysis functions. Before you buy a limited or expensive solution, take a good look at this one. If your main GIS is COM-aware, then Idrisi will integrate with it very nicely indeed.
This software is also attractive for use in a teaching setting because of its breadth of
| "Idrisi should be high on your list of possible solutions." |
Potentially you could do almost anything you want with Idrisi. However, trying to use it as your main GIS software could be frustrating. It has an inefficient interface, limited support for vector analysis, and insufficient cartographic capabilities for most GIS needs, although they are rapidly improving.
| Ratings | |
| Capabilities | 5 |
| Wide range of grid and image analysis and processing functions. Good I/O and georeferencing capabilities. | |
| Integration | 5 |
| Simple to use API. COM-compliant; ability to import, process, and export many raster and image formats. | |
| Documentation | 4 |
| The manuals are pithy and instructive, the help system consistent, compact, and helpful. Authoritative and complete references are lacking, though, so the user is left guessing at some undocumented syntax and error messages. | |
| Cool features | 4 |
| Good integration and use of metadata. Fast and versatile projection computations. Ability to create symbol sets to standardize the appearances of maps. Good management of files and folders. | |
| Robustness | 4 |
| A bit flaky, but little tendency to crash or lose data (on Windows NT 4.0). | |
| Accuracy | 4 |
| Documentation is unclear about speed-accuracy tradeoffs; alternative algorithms are available to produce faster results, which is good; but the user will need to test any algorithm carefully before relying on it, because different choices may produce different results. | |
| Speed | 3-4 |
| Algorithm speeds are adequate, but not the fastest possible. Display speed is poor in some circumstances: for example, linked zooms of large images can take minutes. | |
| Automation | 2-3 |
| Antiquated and severely limited "macro" capability; requires many sequences of operations to get simple things done. But: decent log file and ability to access macros through VBA. | |
| Mapping | 2 | On-screen images have high spatial and color resolution, but tools for cartographic control are limited or non-existent. |
| Ease of use | 2 |
| Many operations require excessive repetition to complete; heavy demands are placed on the user to perform basic operations correctly; inconsistent support is provided for error diagnosis and correction. Basic interface support, such as window management, is missing. | |
Introduction
"GIS" covers a lot of ground these days, so let's get it straight: you can ignore Idrisi if you are a Microsoft MapPoint user or if your only interest is in serving up vector images (such as route maps) on the Web. For the rest of us, some part of Idrisi will be uniquely valuable, even if we already have access to high-end GIS software. This review discusses what Idrisi does well, how it might work with other GIS software, and how it might be improved.What Idrisi is made of
Evaluating Idrisi is like test-driving a classic VW Beetle into which someone has dropped a Porsche engine. Its outward appearance belies its capabilities and it would be wrong to compare it either to a compact car or a racing vehicle. To use it and appreciate it, you have to strip it down to its parts.The parts are Idrisi "modules." Most are stand-alone programs. Each typically processes one or more input feature sets (raster or vector format) and outputs one or more data sets (almost always in raster format).
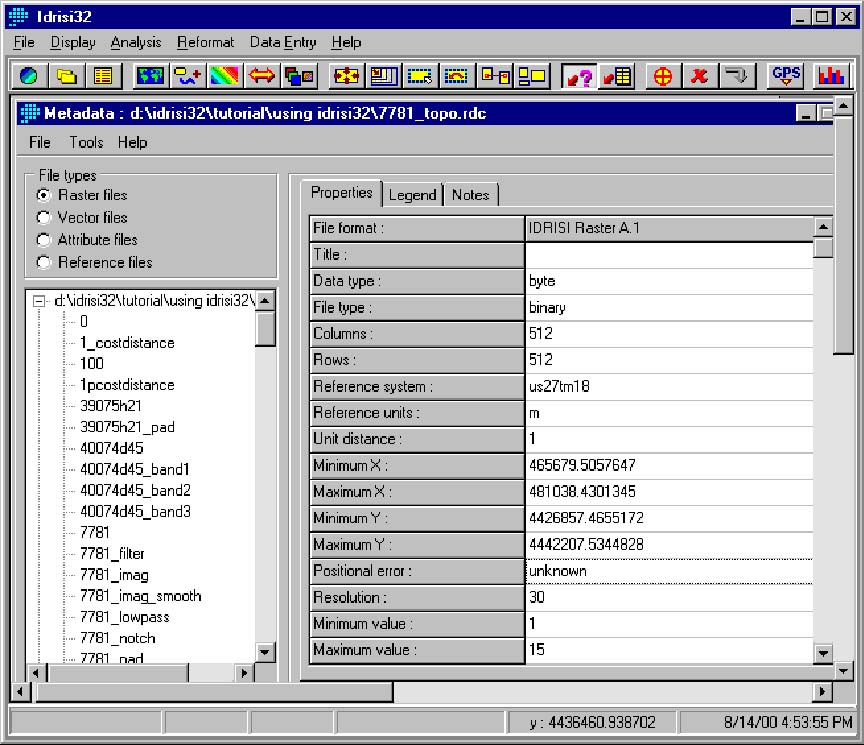 Idrisi's "metadata" window. Idrisi does a nice job of maintaining and actually using metadata. Notice the reference system line (UTM 1927, Zone 18); that was read from SDTS input. Some modules can even recognize and propagate accuracy measurements.
Click to enlarge |
For example, the "toposhape" module classifies each cell of an input digital elevation grid according to its topographic appearance: ridge, valley, convex slope, and eight other categories. The output is another grid of cells, each of which contains a numerical code for the topographic category.
You can execute these modules from the Idrisi Windows interface, from an Idrisi "macro" file, from a separate application (written in a language like Visual Basic, Delphi, or C for example), or from other Windows software (like Excel or Word). Later (below) I will make the case
| "Sooner or later, even the mapmakers-or their clients-will want the computer to help answer the questions that well-made maps provoke." |
In short, when you invest in Idrisi you're really getting the parts to the car and you can use them to soup up your own vehicle. For testing or for simple operations, you can use the parts as assembled by Clark Labs. For sophisticated modeling and analyses you can assemble them using macro or VBA (Visual Basic for Applications) files.
How it works
Further below we discuss the rich set of capabilities included with Idrisi. Before proceeding, though, I want to describe what it's like to live within Idrisi.Clark Labs has written a Windows interface to provide a common, easy to use mode of access to the Idrisi modules. This interface also performs basic functions such as map display, file selection, text file editing, serving up help screens, and importing or exporting files.
The interface is simple and fairly elegant. The main window offers a hierarchical menu system and two dozen buttons as shortcuts to frequently used dialogs. Its status line displays world and image coordinates (simultaneously), shows the time, and provides detailed progress monitoring for longer operations.
Individual dialogs encapsulate the Idrisi modules, so most of the interface work consists of launching the module dialogs via the menus or buttons. You can extend the interface yourself by editing a simple ASCII file describing the menu hierarchy. You can even create menu-level access to non-Idrisi programs.
Although this is appealing to the programmer, it can be dismaying to the experienced user. The reason is that hiding beneath this environment is an antiquated command-line system. Filling out the dialogs requires about as much effort as typing in commands, but you get little in return: like command lines, these dialogs do not identify errors until everything has been filled out; like command lines, these dialogs do not interact with each other (by remembering previous file names, for example); like command lines, these dialogs have to be executed in long sequences to perform some of the simplest analyses.
So, despite appearances, Idrisi's interface exploits few of the advantages offered by the Windows environment, such as the ability to directly manipulate objects visible within a window. Until recently this would have been acceptable, but in comparison to up-to-date interfaces this one feels cumbersome.
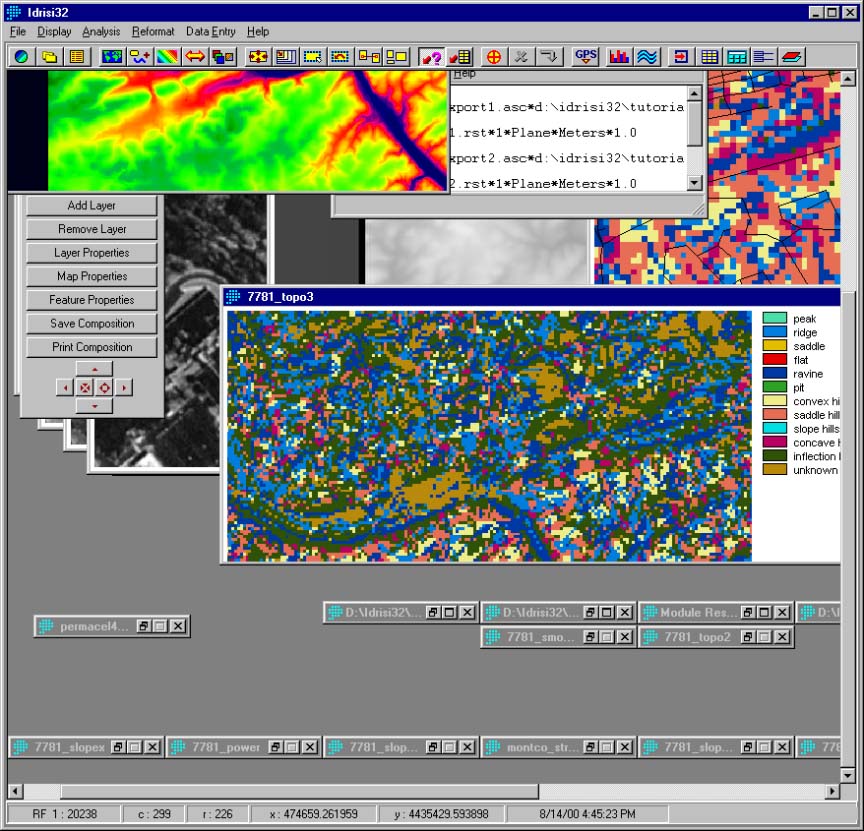 Screen shot of Idrisi during this review. How many windows are open? I have no idea-Idrisi provides no way to manage them.
Click to enlarge |
Nevertheless, you should give this software a look. The reason is that you can easily use the modules from within your favorite analytical
| "...you can easily use the modules from within your favorite analytical or GIS environment." |
Success = Idrisi32.RunModule("Overlay", sCommand, bWaitFlag, sTitle, sUnits, sExtra1, sExtra2, bProcAutoRemove)The rest of the program gives values to these variables and therefore consists of lines likeSuccess = Idrisi32.DisplayFile(sFNWorkPath + sFNOutput, sFNSymbol, iLayerType, iScaleType, isTitle, iLegend, iReserved, bSilentLaunch, sMapWindowName)
sFNWorkPath = Idrisi32.GetWorkingDirand so on. It looks complicated, but Idrisi's truly context-sensitive help provides just the documentation you need and Idrisi's log file helps create a first cut at it. Then you are done: this stuff is re-usable at the push of a button.
sFNOutput = "sierrandvi.rst"
At least one reviewer has called this approach "object-oriented programming." Rubbish. As you can see, it's just the macro language in disguise (a "wrapper," in pseudo-technical terms). But the disguise gives you full access to key Idrisi
| "For a quarter of the price Idrisi will match all those capabilities..." |
If you read on below, you will see just how capable this software is. To buy similar raster capabilities from a competitor (who will go unnamed) you would have to buy their grid analysis module, their image analysis module, and their geostatistical analysis module. I think that would set you back about $6,000 US. For a quarter of the price Idrisi will match all those capabilities and offer some impressive specialized ones on top.
I think it's only a matter of time before someone-perhaps Clark Labs itself-sees where this is going and writes the code to integrate the Idrisi modules with your favorite GIS software, so no programming at all will be necessary.
| SIDEBAR |
| Wrestling with the interface |
What Idrisi can do
One question you are surely asking is "but can it do what I need it to do?" There are two senses to that. It may be you have a specific need right now, or maybe you're thinking of the software as a long-term investment. That is often the case for software in this price range ($1,500 US for a commercial user, varying discounts for government, non-profit, and academic organizations).Software satisfies needs in two similar ways: by doing a particular specialized task (the immediate need) or by providing a suite of general capabilities that can be deployed to solve a wide array of problems, some of them perhaps not foreseen by the software developers (the long-term investment).
Idrisi modules fit into both categories. Many of them exist to perform some general function, such as overlay, filtering, distance calculations, reclassification, map projection, and so on. Well-chosen sequences of such functions are the backbone of effective GIS maintenance and analysis.
Many other Idrisi modules exist only to perform some very specialized function. For example, the "vegindex" module will calculate 19 types of "vegetation index," provided its inputs are the red and near-infrared bands from an earth orbiting satellite image. It is unlikely you will find any other use for this module in a general GIS setting!
Therefore, to evaluate Idrisi fairly, you should know something about its specific capabilities.
Specialized capabilities
Decision support is the unifying idea behind Idrisi's specialized modules. Their outputs may be geographic data, statistical summaries, graphics, and tables. But whatever the form, the purpose is to help a manager or decision-maker take action.I contrast this to the more conventional activities of obtaining, preparing, merging, modifying, and presenting geographic data sets. Idrisi supports these activities too, but not as well as many competing products.
Following the Idrisi manual, I can identify several groups of specialized analyses according to what they do and how they do it:
- "Decision strategy analysis" and "Uncertainty management"
- Image restoration, Fourier analysis, classification of remotely sensed imagery, and radar imaging and analysis
- Vegetation indices
- Time series and change analysis
- Cost analysis
- Geostatistics
Decision support
GIS is frequently used to make resource allocation decisions. Where to locate a nuclear waste facility, where to combine storefronts after a corporate merger, how to zone land, and where to build water and wildlife protection areas are examples of this type of decision.Often many objectives must be met, if only because typically more than one group of stakeholders (each with its own objectives) will be involved. Always there are many criteria for the decision: proximity to roads, water, urban areas, and other geographic resources (or inhibiting factors); elevation, slope, aspect; population density, access to transportation, distance to competitors, and so on.
The basic questions of decision making with multiple criteria and objectives involve trade-offs: how does one balance these different criteria? How can fair compromises be made between competing objectives? To what extent do the answers depend on uncertainty?
Many theories have been developed to answer these questions. They all involve similar calculations to some extent. Therefore Idrisi's decision support modules can be useful regardless of the theory you subscribe to.
If you know something about decision analysis, then you should be aware that the techniques
| "...the simplifying power of well-constructed software is a sanity preserver." |
These techniques use fuzzy set procedures, Bayesian updating of prior information, "Dempster-Shafer" updating, weighted linear combinations, and relative ranking of criteria. Idrisi provides modules for all of these.
You can use basic overlay and "map algebra" procedures to perform most of these operations in any GIS. The Idrisi manual points this out, but makes a case-a valid one, I think-for the advantage of combining these operations to streamline the procedures. These analyses can be complex, so the simplifying power of well-constructed software is a sanity preserver.
There is more to it than that, however. How many times have you heard of a new technique or read a paper and thought, "that looks useful, but how would I ever implement that? It's too complex; it's something for the academics and too tricky/complex/risky/difficult for my organization to do?" Having easy access to a rich set of tools-and adequate (albeit sparse) documentation for their use-changes all that. Access, efficiency, easy of use, and documentation combine to overcome these objections. They expand the power of the GIS professional to do useful things (as opposed to simply process data).
Idrisi does provide two unique decision-analytical operations. The fuzzy set operators let the user specify and combine fuzzy membership functions in very general ways. This is a powerful technique that could be pressed into service in many other GIS contexts for exploring the consequences of ignorance or uncertainty.
The other unique operation is an optimization procedure ("MOLA") to allocate land according to competing objectives-the zoning problem. The manual presents a case study to identify 1,500 hectares for industrial use and 6,000 hectares for agricultural use. These are "complementary" objectives, because to a large extent areas suitable for one use may also be adequate for the other. To solve this problem, you first develop separate suitability maps for each objective. Idrisi's MOLA module then identifies the best areas for each objective. There will be some overlap consisting of regions highly suitable for both objectives. MOLA apportions these regions (using user-established weights) among the objectives and then iteratively searches for replacement regions to make up the loss. The resulting map is a compromise of sorts, but the best possible one in a well-defined way.
Since writing the first draft of this review in August, I have had the
| "Idrisi is the only GIS software ... that can perform this kind of operation without extensive programming." |
An interesting thing about Idrisi is the frank acknowledgment by its vendor that the software is "still under active development." Thus, as a potential long-term investor in this technology, you are buying into the prospect of receiving genuinely new and better solutions with future upgrades.
MOLA, illustrated.
 Click to enlarge
|
Image processing
The processing of raw images is a black box to most GIS people. We are consumers of images processed by specialists working in government or commercial imaging firms. So why do we need any image processing capabilities in our own systems?Sooner or later most of us will encounter situations requiring additional processing. If you scan your own photograph, it may require retouching, contrast enhancement, and georeferencing. The mapmaker's version of Murphy's Law says that most geographic features span the boundaries of two or more maps, so we have to mosaic images. Only then do we recognize the need to balance colors and patch over gaps. Finally, when you start to do things with grids or images-digitize features, classify land use, compute slopes-you notice the errors, "noise," and other anomalies that must be filtered out. All this is "image processing."
Idrisi includes sophisticated and powerful modules for image noise reduction, filtering and smoothing, and classifying images. The manuals provide an excellent, concise introduction to the process. After reading them you will want to know more, but you will also
| "The suite of image classification tools is impressive." |
(I tested the accuracy of the Fourier analysis modules by computing the Fourier transform of a large grid, inverted that, and compared the result to the original. Accuracy was uniformly about seven significant digits: at least single precision.)
The suite of image classification tools is impressive. Many of these share algorithms with the decision support modules, such as Bayesian and Dempster-Shafer updating. Others use statistical algorithms, such as principal components analysis, that will be reused in the time series modules (see below).
Customized image smoothing using Fourier Analysis.
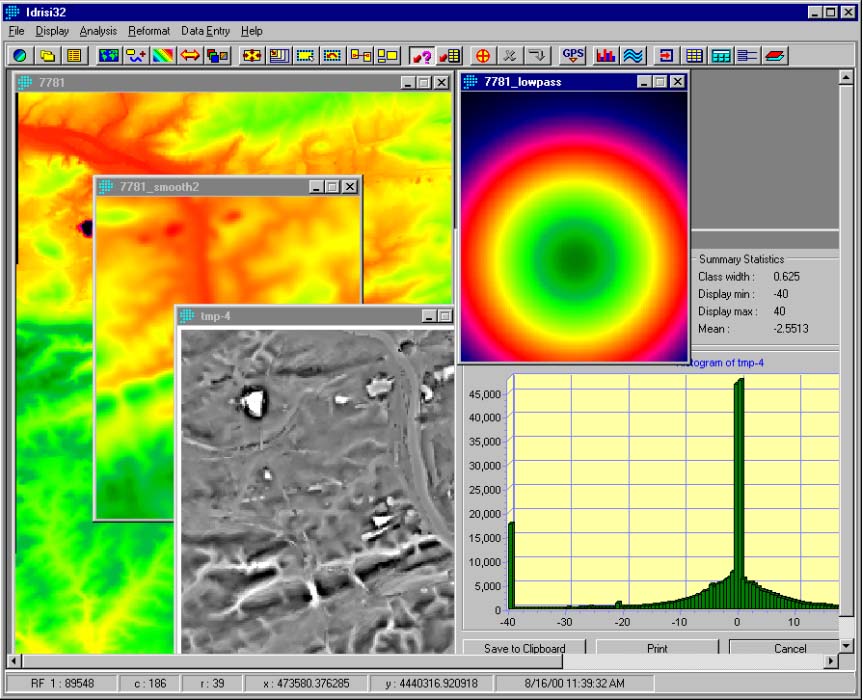 Click to enlarge
|
Vegetation indices
A single module, VegIndex, computes 19 indices from specific bands of satellite images, including LANDSAT, SPOT HRV/XS, and the NOAA AVHRR.Any one of these indices could be computed using a GIS with adequate map algebra capabilities: arithmetic operations and square roots suffice. But how readily would you perform the computation, or experiment with alternatives, if you had to look up a formula in the literature, program it, and test it?
Time series and change analysis
Change analysis assesses a series of images of the same place obtained at different times. An image ultimately is an array of numbers. Statisticians have developed very powerful tools for assessing series of numbers: autoregressive integrated moving average (ARIMA) processes, trend analysis, Markov chains, and spectral analysis to name a few.These analytical methods do not readily generalize to time series of images, however. Idrisi does not implement any of them. (I am expecting to see Markov chain capabilities appear soon, though.) It offers instead a version of its Principal Components Analysis (PCA) module.
Most change on the earth's surface is slow, gradual, and localized. Thus successive images of a place will be strongly correlated. PCA is a method for assessing correlations and for ferreting out information going beyond this simple observation.
With two images, for example, PCA will report a "principal component" that is generally the average of the two images. The second component will be proportional to their difference-that is, the change between the images. The PCA output will include a statistic, "percent of variance," that quantifies this change. The difference of the images maps out the pattern of change.
With more than two images, PCA will
| "...having [PCA] available in one module is very convenient." |
This is a technique that could be implemented by integrating some basic raster GIS functions with a decent statistical software package, but having it available in one module is very convenient.
Surprisingly, PCA is also the module Idrisi uses to compute correlation or covariance matrices. This fundamental operation applies, however, only to images in "byte binary form." Thus, to use it, you not only have to convert your data, but you also have to shoehorn them into 256 integer categories. This is a mystifying restriction. The need to keep converting raster image formats among combinations of floating point and integer, byte and word lengths, is one of the more enduring frustrations in working with this software. Making the details of data representation more transparent would be a great improvement.
Cost surface analysis
This technique sounds like an economic procedure, but it is very general indeed. An illustrative economic application concerns building a pipeline to span two locations. The cost to build the pipe depends not only on how long it is, but how difficult it is to build at any location. The cost to build a unit length of pipe may depend on access to roads, slopes, and the presence of water.
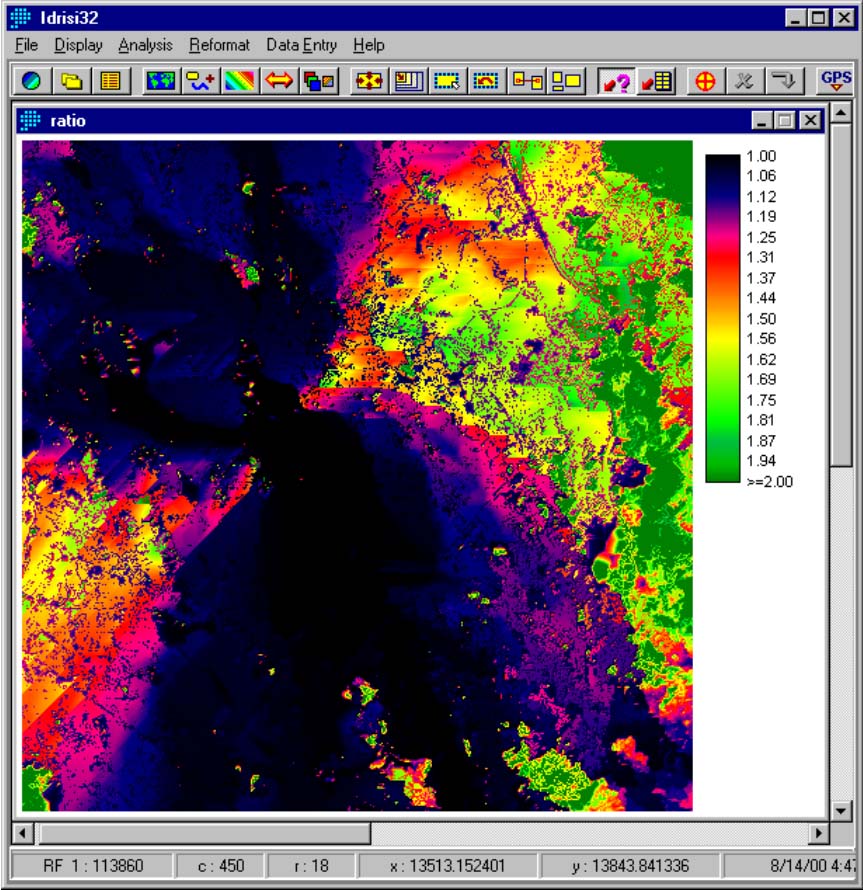 Map showing the ratio between the CostPush "solution" and the more accurate "CostGrow" solution to a tutorial exercise. (The tutorial used the incorrect CostPush solution.) The irregular pattern to the ratio correctly suggests that "least-cost" paths developed from these solutions will diverge substantially from each other.
Click to enlarge |
You combine all these factors into a map of potential costs at every possible point. A least-cost algorithm then inspects this map to find the minimum-cost (not minimum distance) routes between points.
The same algorithm can be pressed into service to solve network problems. For example, you could create a highway map showing typical travel speeds along each segment of highway. A simple calculation will transform that into a map of time required to travel a unit distance (hours per mile). Establish an artificially high time wherever roads do not exist. The minimum-cost route between two points on the highway network displays the minimum travel time solution.
Implementing a good least-cost algorithm is tricky. The problem is that the solution is not local: it potentially depends on the entire cost map. To illustrate, suppose you are on foot in the wilderness. Ahead of you lies gently sloping grassland that will take a week to cross, but travel is easy-you can cover 20 kilometers a day-and your goal lies in that direction. Behind you
| "The same algorithm can be pressed into service to solve network problems." |
It depends. Perhaps just behind that next mountain, one day's walk away in the wrong direction, is a city. You could just walk to the city, hop a bus, and be at your destination in two days rather than seven. The possibility of such solutions makes it difficult to construct a fast and accurate algorithm.
It is not uncommon for a raster-based GIS to offer a least-cost algorithm, but such algorithms usually take a long time to execute. A simple problem using a grid of, say, a million cells, can take an hour or more to solve on a PC workstation.
Idrisi offers two algorithms, "cost push" and "cost grow," in its cost module. The tutorial illustrates the use of the cost push algorithm. It works extremely quickly, producing a solution in eleven seconds. Unfortunately, this solution is a poor one, far from the optimum. You can use the cost grow algorithm to check. This took five minutes to complete. The pattern of minimum costs it found was quite different from the pattern "CostPush" found and differed by up to a factor of two: a large amount. The help system mentions a limitation to CostPush, but provides inadequate guidance in its use.
Idrisi also offers modules for representing anisotropic costs: problems where the cost to move through a point depends on the direction of motion. Such problems arise when costs depend on gravity (upslope is more expensive than downslope), wind, or some other directionally varying aspect of terrain.
The hard part appears not to be solving this kind of problem, but representing it efficiently. It would seem you need a 3D array of values. The coordinates in this array would be the usual positional coordinates plus a third one to represent direction.
Idrisi solves this by separating the spatial and angular parts of the problem. You, the user, must describe how a cost varies with direction relative to a fixed azimuth. This can be done by using Idrisi's built-in method, which is controlled by a single parameter, or you can supply a file of 7,201 different costs (one for each three minutes of azimuth around a full circle). Then, you must also provide two more maps. One reflects a base cost at each point and functions like the usual cost surface; the other describes the reference azimuth at each point. (In a gravity-driven problem, for example, this second map could be the aspect.)
The Idrisi documentation suggests that anisotropic cost modeling could include "point source pollution studies,...and possibly oil spill monitoring and projection." You should be very careful here: the ad-hoc approach taken by Idrisi for anisotropic cost modeling does not necessarily correspond to any realistic model of pollution flow or dispersion. You should view this entire module as useful for experimenting, but do not mistake it for a valid flow or dispersion model.
This raises a very interesting issue of concern to GIS users and developers everywhere. Many of the Idrisi modules are sophisticated solutions. Like any sophisticated tool, they should be backed up by the knowledge and experience of the software user. However, human behavior is strongly at work here. When you have a wonderful toolbox, why not try out some of the tools and see what they do? Even the most casual, uninformed user becomes capable of producing high quality output that looks meaningful, whether it is or is not. The uses of anisotropic cost modeling suggested by the documentation appear to suggest just this kind of experimentation. But do you think if I say, "don't use it if you don't know what it does," that anybody will heed? The problem of potential software misuse is not of Idrisi's making, but this kind of documentation does not seem to be helping.
Geostatistics
Idrisi offers a front end to Edzer Pebesma's GStat software (http://www.geog.uu.nl/gstat/index.html). This software includes variogram modeling, cross-validation, kriging, conditional simulation, and cokriging. If you don't know what these things are, then you should not be using GStat; if you do know what they are, then you will appreciate having these capabilities.Note that Gstat is freely available on the web with source code (according to the GNU license) and that it already reads and writes many common GIS data formats, including ArcInfo Grid, ER Mapper, and netCDF.
| SIDEBAR |
| Idrisi macros, map algebra, and computational speed |
General capabilities
Idrisi contains many modules implementing basic "map algebra" operations: arithmetic with grids, statistics, and other operations. A feature-by-feature comparison with other raster software is difficult, because many map algebra operations are redundant. For example, Idrisi offers a reciprocal function. You might not find that in a competitor's toolbox, but only| "...you can use the Idrisi modules to reproduce almost any Spatial Analyst computation." |
Taking this into account, I cataloged all of Idrisi's modules. Some are unique or go well beyond the capabilities of ESRI's Spatial Analyst extension for ArcView (which in turn is a significant subset of ESRI's Grid module for ArcInfo); MOLA is a good example of one, and so are many of the others discussed above. Collectively, you can use the Idrisi modules to reproduce almost any Spatial Analyst computation.
The only general-purpose functions missing from Idrisi are the "local statistics." These are operations performed on a "stack" of images, one cell at a time. For example, I can find no module in Idrisi that will compute the median value, cell by cell, for a group of 32 grids, nor could I find analogs of local comparison functions ("GridsGreaterThan") or local selection ("Pick"). These are powerful procedures that belong in a full-featured raster GIS and they are not readily replaced by combinations of other procedures. However, many people never use these procedures at all.
Spatial Analyst/Grid includes some "morphological functions" that are useful for pre-processing images for raster-to-vector conversion. None of these appear in Idrisi, which made me suspicious that raster-to-vector would not be a good idea. I was wrong. Idrisi certainly has the basic raster-to-vector and vector-to-raster capabilities you would expect. When you convert raster lines (including polygon boundaries) to vector format, the result traces pixel boundaries, leading to a "stairstep" pattern. In many ways that's a good thing, because it is faithful to the original raster representation. Idrisi's "LineGen" module will simplify the result using the standard Douglas-Puecker algorithm. It runs quickly and, because Idrisi's internal vector representation contains topological information, it maintains the adjacency relationships among polygons. See the figure for an example.
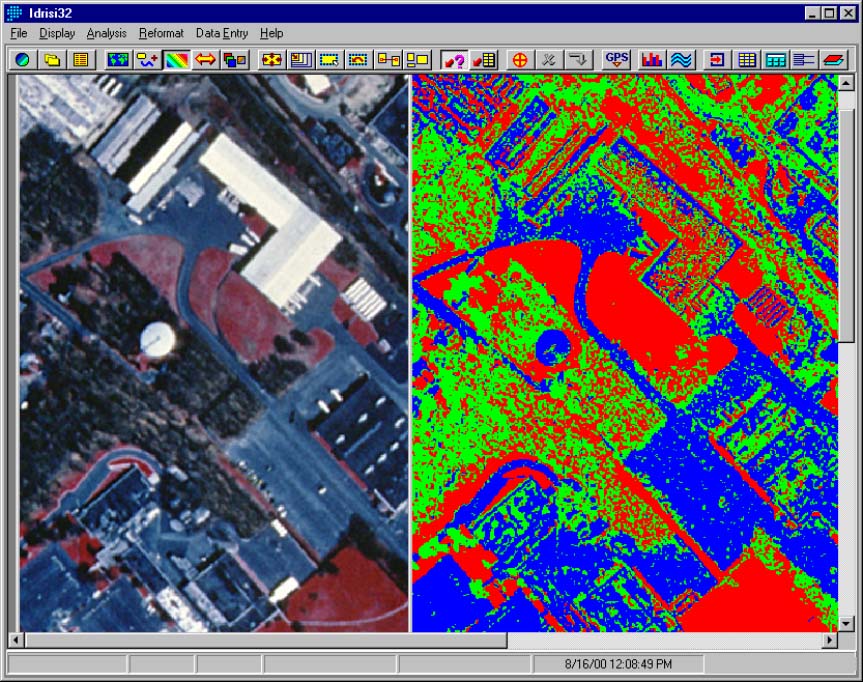
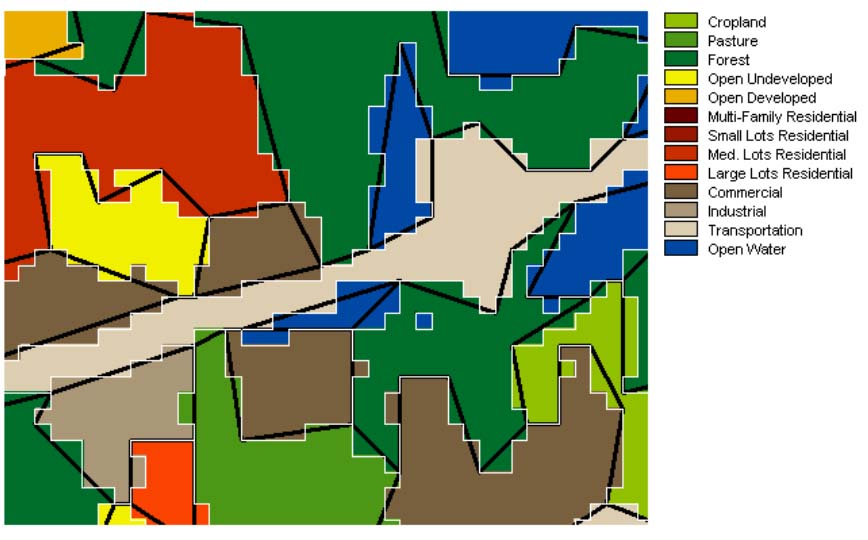 The solid regions show the original raster image of land cover. The thin white lines show the vector boundaries created by Idrisi's raster to vector conversion routine, polyvec. The thick black lines resulted from applying the Douglas-Puecker algorithm in the LineGen module using a tolerance of 30 units. (The tolerance value lets you control the accuracy-simplicity tradeoff.)
Click to enlarge |
Idrisi has a rich set of capabilities for resampling images, converting their data types, windowing them, and resizing them. However, these have to be explicitly invoked: if your inputs to a module are not exactly the right type or size or resolution, then usually you get nothing but an error message (see sidebar). Most of the time the software does not perform even the most obvious conversions automatically; you have to tell it to do so.
There are some capabilities to handle null or missing values, but they seem to vary according to data type and the whims of the module performing an operation. You can overcome this limitation with careful map algebra and by "masking" the results, but doing so adds yet one more layer of complexity and inefficiency to all operations.
Why not make Idrisi your main GIS?
Good question. One answer goes right back to Idrisi's roots: despite laudable efforts to integrate and use vector data, this is still a raster program. It cannot do as much with vector features as a GIS built from the bottom up to process vector data. It has minimal tools for vector analysis: everything has to be rasterized to use the analytical modules. And you don't want to go backwards and perform raster to vector conversion. That does not work if you need quality or accuracy.Map making is a key GIS function. Idrisi probably will not do it the way you will want to. It is missing too much: it lacks basic layout
| "There is a nice little vector projection engine lurking there..." |
Judging from the relative popularity of various GIS add-ons I have published, it appears a lot of people spend a lot of GIS time simply labeling maps. The efficient way to start this process is by deriving labels from the feature attributes themselves. Idrisi cannot do this; indeed, it cannot use text attributes to make a map at all. It has a basic labeling function, but once a label is placed, your only choice for editing it is to delete it and replace it.
There are some jewels in Idrisi's depths. It readily and accurately imported a four-megabyte shapefile of TIGER street
| "There are some jewels in Idrisi's depths." |
Where Idrisi Fits In
This is an exciting product. It is showing the maturity of a decade or more of development. It is reflecting advances in GIS analytical techniques. It displays a thoughtful, coherent approach to spatial modeling.If you are looking for advanced modeling capabilities or a rich set of raster analysis tools, then Idrisi should be high on your list of possible solutions. If you just want to make maps and have high cartographic standards, try a different product. Sooner or later, though, even the mapmakers-or their clients-will want the computer to help answer the questions that well-made maps provoke. Idrisi would be a good product to have available when that time comes.
References
Binford, Michael W., Clark Labs' Idrisi32. Geo Info Systems, April 2000, pp 40-42.Binford, Michael W., Idrisi 2.0 for Windows. Geo Info Systems, September 1997, pp 48-52.
Davis, John C., Statistics and Data Analysis in Geology (Second Edition). 1986, John Wiley & Sons, New York. ISBN 0-471-08079-9.
Fannon, John, A Critical Evaluation of the Usefulness of Idrisi for Windows 2.0 as a Natural Resource Information System.
http://mscgis.geog.le.ac.uk/98-jaf16/
apps/apps1.html
(accessed 8 August 2000).
Note: URL broken as of 25 October 2000
Gorham, Bruce E., Idrisi for Windows 2.0. GeoPlace.com, 1998.
http://www.geoplace.com/gw/1998/
0298/gw980200qt2.asp
(accessed 8 August 2000).
Hamilton, James D., Time Series Analysis. 1994, Princeton University Press, Princeton, NJ. ISBN 0-691-04289-6.
Heeter, Carrie, The Look and Feel of Direct Manipulation. Fall 1991, HYPERNEXUS: Journal of Hypermedia and Multimedia Studies.
http://commtechlab.msu.edu/randd/
research/LookFeel/
(accessed 11 August 2000).
Huggett, Jeremy, Idrisi for Windows 1.0. Spring '96 - '97, Craft: The Newsletter of the CTI Centre for History, Archaeology, and Art History, Issue No. 16.
http://www2.arts.gla.ac.uk/www/ctich/
Publications/craft16_5.htm
(accessed 8 August 2000).
Keeney, Ralph L. and Howard Raiffa, Decisions with Multiple Objectives. 1993, Cambridge University Press, Cambridge, England. ISBN 0-521-43883-7.
Limp, W. Frederick, R-E-S-P-E-C-T: Raster GIS Packages Finally Receive Well-Deserved Recognition. GEOWorld, May 2000, pp 44-48.
Morgan, M. Granger and Max Henrion, Uncertainty: A Guide to Dealing with Uncertainty in Quantitative Risk and Policy Analysis. 1992, Cambridge University Press, Cambridge, England. ISBN 0-521-42744-4.
Roe, Gene V., Component Software-It's Coming! URISA Journal, Fall 1996, Vol. 8. No. 2, pp 78-80.
Simonovic, Slobodan P., Idrisi for Windows 2.0. J. of Geographic Information and Decision Analysis, 1997, Vol. 1 No. 2, pp 151-157.
http://publish.uwo.ca/~jmalczew/gida_2/
Idrisi/Idrisi.htm
(accessed 8 August 2000).