Digital elevation models are an important part of many geographic information system datasets and studies. Further, the distribution and characterization of topographic attributes across a landscape can be vital information for geomorphological, hydrological, and biological applications (Moore et al. 1991). Equally important are the parameters calculated from DEMs. Slope is, perhaps, the most common. However, the standard slope tool in ArcGIS (10.4.1) only examines a 3x3 neighborhood and does not include the center cell. [For a more complete discussion of slope calculations, see Hickey et al (1994) and Dunn and Hickey (1998).] While this is acceptable for a broader-scale examination of slope, customization of ArcGIS terrain processing tools with Python code can help us calculate slope along directions specific to a researcher’s needs. Theoretical applications of a directional slope tool might include finding the slope along a stream’s natural path, anticipating the direction of water flowing across a surface, investigating the direction of wildfire’s movement across diverse terrain, or measuring the relative slope direction along a hiking trail.
This article addresses a method for calculating slope along a flow direction grid. In the hydrologic example, this would be the equivalent of calculating the maximum downhill slope angle. If the user is interested in the slope along any other direction — for example, along the direction of a moving fire, stream, or trail — an FD grid must be created which represents the direction of movement along the feature under investigation.
Coding
The objective of this project is to calculate slope angle based upon a combination of a DEM and the output of an FD calculation. The input to FD is typically a DEM, and the output identifies one of eight surrounding cells with the direction of the steepest slope inclination. The output is coded as shown in Figure 1.

Figure 1: FLOWDIRECTION output
Alternatively, FD can be calculated from any other raster layer. For example, a user could create a raster dataset which depicts fire movement, and then FD can be calculated from this data plus a DEM.
Regardless of the intended application, the code presented here takes DEM and flow direction output rasters and calculates directional slope by calculating slope (rise/run) from the center kernel cell to the single adjacent cell along the subsequent FD raster.
For the curious, the workflow is shown below in legacy AML code (Hickey et al, 1994). FLOW is the FD grid (see Figure 1), DEM is the filled DEM, SIZE is the pixel size, DIAG is 1.4*pixel size (or the diagonal distance between two adjacent pixels), and ANGLE is the calculated slope:
if (FLOW eq 64)
ANGLE = deg * atan((DEM - DEM(0, -1)) div %SIZE%)
else if (FLOW eq 128)
ANGLE = deg * atan((DEM - DEM(1, -1)) div %DIAG%)
else if (FLOW eq 1)
ANGLE = deg * atan((DEM - DEM(1, 0)) div %SIZE%)
else if (FLOW eq 2)
ANGLE = deg * atan((DEM - DEM(1, 1)) div %DIAG%)
else if (FLOW eq 4)
ANGLE = deg * atan((DEM - DEM(0, 1)) div %SIZE%)
else if (FLOW eq 8)
ANGLE = deg * atan((DEM - DEM(-1, 1)) div %DIAG%)
else if (FLOW eq 16)
ANGLE = deg * atan((DEM - DEM(-1, 0)) div %SIZE%)
else if (FLOW eq 32)
ANGLE = deg * atan((DEM - DEM(-1, -1)) div %DIAG%)
To implement this approach using Python, we converted the raster to a NumPy array. NumPy is a special Python module for working with math and numbers. A NumPy array can store values that represent rows and columns in a grid. A programmer can then get the value of any cell in the raster by referencing the cell’s row and column. This allows for making customized calculations using values from adjacent grid cells, something that is not only useful for customizing slope, but any kind of neighborhood statistic.
Convert the DEM and flow direction rasters to NumPy arrays like this:
fdirArray = arcpy.RasterToNumPyArray(fdir, "", "", "", -9999)
elevArray = arcpy.RasterToNumPyArray(elev, "", "", "", -9999)
Later in the code, we set up some Python tuples of flow directions, using the term rook for adjacent cells and diag for diagonal cells.
rookDirs = (1,4,16,64)
diagDirs = (2,8,32,128)
Then later on, after finding the difference in elevation between the pixels along the FD, we can apply the correct slope calculation depending on the flow direction. Note that the Python code below shows slope as a percentage, whereas the AML above used degrees. You can apply whichever approach you want by modifying the math:
# If cell is in diagonal direction, divide the difference by the orthogonal size
if fdirPixel in diagDirs:
maxSlope = ((elevPixelDiff * 1.0) / (math.sqrt(2 * (cSize * cSize))))
# If cell is in rook direction, divide the difference by the cell size
elif fdirPixel in rookDirs:
maxSlope = ((elevPixelDiff * 1.0) / cSize)
For this to work properly, all inputs must be in a file geodatabase. Also remember that, for any raster neighborhood operation, the outer rows/columns are always inaccurate and the user should work off a study area that is larger than necessary – and only clip to the final area after all analyses are complete.
A link to the full code is provided at the end of this article.
Sample Project Walkthrough
The study site is near a popular hiking trail outside Ellensburg, Wash. (Figure 2). It was chosen due to the relatively straightforward topography, lack of vegetation cover, (shrub steppe ecosystem), and familiarity to the authors. Our goals were to first calculate the maximum downhill slope angle (slope along the direction of water flow) and then, to calculate slope along the direction a simulated fire might propagate. A 10-meter DEM covering the study area extent was downloaded from the USGS online data library, Earth Explorer, stored in a .dem format, and imported into an ArcGIS file geodatabase. All data was spatially referenced using NAD27 - UTM zone 10N. All data was clipped to an area a bit larger than the area of interest. We then ran the Fill tool on the DEM to remove sinks and small data issues. [Author’s note: Always run Fill; it cleans up minor issues that seem to be prevalent in any DEM you might download.]

Figure 2. Oblique view of the study area, looking south. The burn area is highlighted in red; the fire started to the far right (west).
Following the study area data clip and the DEM fill operation, FlowDirection was used to create an FD raster. Finally, the presented directional slope script was run on the data. The output is the maximum downhill slope angle (Figure 3).

Figure 3. Upper left, DEM of study area with fire aoi for reference. Upper right, hillshade. Lower left, flowdirection output. Lower right, maximum downhill slope angle.
To examine the slope along which a simulated fire would travel, we digitized a series of fire lines, assuming these represented the location of the fire line at different times. We also created a polygon file representing the total area burned. It’s important that these vector files be in the same datum/coordinate system as the DEM.
We then assigned “elevations” to the fire. The numbers themselves don’t really matter as long as the highest values are where the fire started and the lowest, where it finished. We then ran the Topo to Raster tool on the fire lines. When doing this, make sure to use the clipped DEM as the input to the “output cell size” and “output extent” (Figure 4). This will ensure that the DEM and your new fire raster overlay exactly. Run Fill on this fire raster, then FlowDirection. This FD layer will represent the direction the ‘fire’ is moving (Figure 5).

Figure 4: DEM created from the fire lines. Fire lines (with labels, 100 was where the fire started; it finished at 30) and fire AOI for reference. This is the same AOI as is shown in Figure 3.
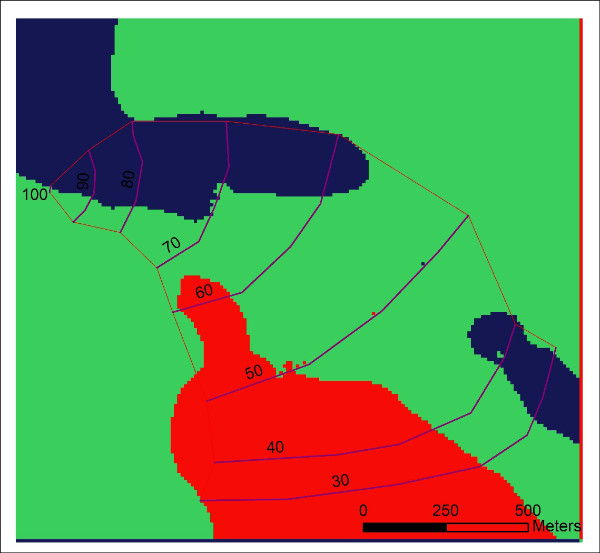
Figure 5: FLOWDIRECTION output based on the fire dem in Figure 4.
We then ran our script using the DEM and the fire FD layers as inputs. The output is the slope of the land according to the direction of the moving fire (Figure 6).

Figure 6: Slope angle along the direction of fire movement. Note, negative values represent areas where the fire is moving uphill; green is downhill.
Debugging List
Are you getting odd results? Very high or low values? Or even large areas with a 0 slope? Here are some suggestions for things to check:
- Is everything in the same datum/coordinate system? Never use geographic (lat/long) coordinates when working with raster data.
- Did you remember to run Fill on your DEM?
- Ensure that all the raster layers overlay perfectly and have the same number of rows, columns, and cell size.
- Ensure that the vertical units are the same as the horizontal units (meters or feet).
- All your input files should be within a file geodatabase.
Conclusions
If you need to go beyond the out-of-the-box functionality of the ArcGIS raster analysis tools, you can use the ArcPy site package to write custom tools. A particularly powerful way to work with DEMs is to use NumPy arrays to iterate through each cell and apply your own formulas. We’ve demonstrated this by implementing a calculation to find directional slope. The walkthrough project describes how such a tool can be applied toward either modeling the path of a wildfire or of water flowing downhill. The code is available at http://www.onlinegeographer.com/slope/slope.html.
References
Dunn, M. and R. Hickey, 1998, The Effect of Slope Algorithms on Slope Estimates within a GIS. Cartography. V. 27, no. 1, pp. 9–15.
Hickey, R, A. Smith, and P. Jankowski, 1994, Slope length Calculations from a DEM with in ARC/INFO GRID. Computers, Environment and Urban Systems, v. 18, no. 5, pp. 365 - 380.
Moore, I. D., Grayson, R. B., & Ladson, A. R. (1991). Digital terrain modelling: a review of hydrological, geomorphological, and biological applications. Hydrological processes, 5(1), 3-30.