Forestland in the southeast region of the United States faces many natural and negative impacts. Among the forefront of these impacts are weather events. Problematic weather events, such as drought, tornadoes, straight-line winds, and hurricanes, present a dilemma for forestry consultants who operate in the area. Luckily, there are several geospatial solutions to minimize cost and man hours in response to these events. This article will explore weather data collection and analysis methods that could prove extremely helpful to forestry professionals.
Severe weather events have varied effects on timbered areas, depending on many factors such as tree species, tree height, and surrounding topography. In areas affected by severe weather, it is important for landowners and, likewise, consulting foresters to act quickly. What can be salvaged of the damaged timber needs to be harvested, and the area prepped for the introduction of a new plantation if needed. In fact, much of the large forestland under the management of consulting foresters is owned by absentee landowners. In these cases, unless the forester is aware of the damage, the landowner would be in dark. This is why it is important for forestry professionals to respond effectively.
For small to mid-sized forestry consultants, there is no effective and affordable substitute for a boots on the ground approach to storm damage appraisal. However, there are several GIS techniques that can facilitate more efficient site visit planning. Sending foresters to inspect areas where storms have been reported in the local news, or mentioned on the local radio stations, can often lead to aimless driving and fruitless searching. A well-informed GIS analyst can cut down on search and travel times by creating focused, high-damage probability areas using readily available data and a dash of spatial analysis.
Since forestland makes up much of the southeast region’s land cover, a forestry consultant may manage properties that extend over multiple states. Keeping this in mind, it remains an important aspect of a GIS professional’s duties to research reliable resources for damage report information that is attached to accurate spatial data. One excellent source for this data type is Iowa Environmental Mesonet. Using Valid Time Event Coding, IEM consolidates and displays information from NEXRAD, the National Weather Service and many other reputable weather sources. Here you will find reported damage, the type of damage observed, and when the damage was reported, all attached to an XY coordinate. The National Oceanic and Atmospheric Administration is also constantly updating and growing their datasets as it pertains to inclement weather and damage information. Combining several of these datasets will reveal damage patterns and severe weather paths. Analyzing these paths and patterns will give responders a clear picture of the resulting damage and assist in making informed site visit decisions.
Focusing in on Problem Areas
Once this data is collected from NOAA and IEM, there are a few simple steps to focus in on potentially problematic areas. The process is as follows.
1. Download and import NOAA storm damage data and IEM storm report data into ArcMap for Desktop or ArcPro. Sort the data by date and pertinence to your project.

2. Create a range of buffers in increasing distance increments around the selected data, dissolving polygon boundaries as you go. In this instance, I’m using 2 miles, 5 miles, and 10 miles.

3. Overlay managed properties to see where they fall in relation to your new potential storm damage layer.

4. Determine tracts most likely to have received damage.

5. Using the buffers created in Step 2, assign values to the tracts by proximity to buffer areas.
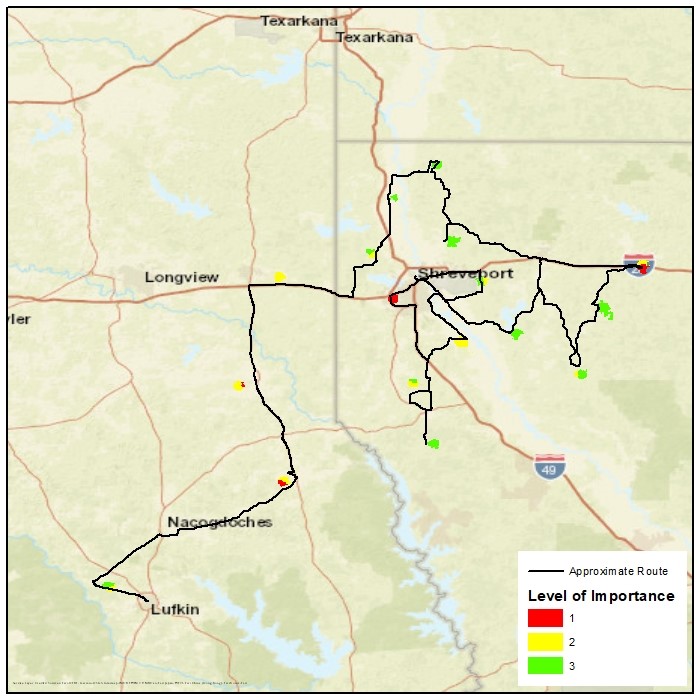
6. With ArcMap’s routing analysis tool, create the optimal route for assessing your chosen properties. If you do not have Esri’s Spatial Analysis feature, Google’s My Maps or QGIS are free options for creating a route.
Implementing this process, which utilizes free, widely available data, is an excellent starting point for responding to natural disasters such as tornadoes and hurricanes. Performing site visits to multiple properties is time and labor intensive. The tools and methods described in this article can help industry professionals cut down on this time and labor, enabling them to work smarter, not harder. More data and data sources are added every day, so remember to check routinely. Don’t forget to bring your drone!