 ESRI, Inc.
380 New York Street
Redlands, CA 92373
800-970-0033
BusinessMAP Financial is a bold new step, creating a product for a specific vertical by combining both an affordable mapping solution and a surprisingly vast dataset. Traditionally, Business Geographic products have always had two hurdles - especially for new users, of 1) being perceived as difficult to use; and 2) expensive. BusinessMAP Financial addresses both those challenges in an easy to use, affordable product targeted at the financial services industry.
The key factor in any desktop mapping product is the data that comes with it. This is the dataset that come with this product (from the ESRI Web site).
- ESRI's demographic data with estimates and projection
- Community Tapestry Segmentation System
- Credit Union Data from National Credit Union Administration
- BranchInfo Data from RPM Consulting
- MarketBank Data from RPM Consulting
- D&B Business Listings (over 18 million business listings)
- Community Development Financial Institution Data
- Aggregate total employee data from infoUSA
- Street-level map data for North America from Tele Atlas
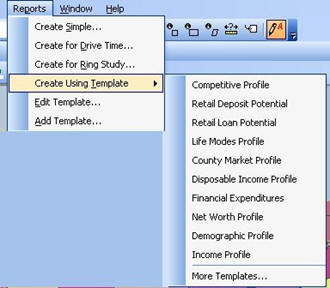
BusinessMAP Financial also comes with 25+ report templates for standard office products like Microsoft Excel, Word and PowerPoint. The templates get at demographics, net worth, deposit potential, loan potential and competition, and also access Tapestry’s LifeModes segments. There are also templates for both radii and drivetime reports. You can customize your own templates as well.
Using BusinessMAP FSE
To show the product’s functionality, I worked through a workflow for a hypothetical case study. My workflow steps are listed below, and worked through individually. These are the kinds of steps you might take if you were involved in a site selection project in which you wanted to look at market potential or study the competitive landscape. I selected a single bank in Jackson, Mississippi (from the layer titled Banks). The data contained in the bank record includes branch deposits, ownership, all the federal identification numbers for type, services offered, etc.
Workflow Steps
- Select an area in Jackson and identify a bank to study
- Create three drivetime polygons around that bank
- Look at the demographics within the drivetimes
- Look at the net worth profile within the drivetimes
- Look at the competition within the drivetimes
- Look at the deposits potential within the drivetimes
- Look at the retail loan potential within the drivetimes
- Determine the nature of the lifestyle segments within those drive times
This is an image of the map of the Jackson area, and the polygon I used to select banks.
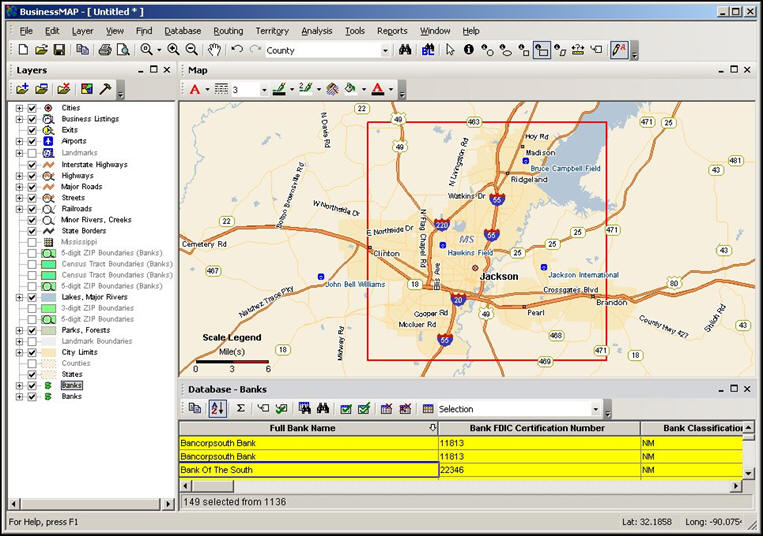 |
A list of banks within the selected polygon show up below the map (in the yellow area). I randomly picked The Bank of the South for this hypothetical analysis.
Step 2
By right clicking on the record for the Bank of the South, I selected drivetimes from the pop-up menu. I could have select radii (or ring study), just zoomed to this bank or done a number of other things by just a right click on the record in the data view, as shown below, which is handy.
 |
When I selected 'Drive Time Analysis' a new dialog appears. I then get a choice of drivetime lengths, and options about how to display them, including color and transparency. I also get to choose the symbol for the bank location.
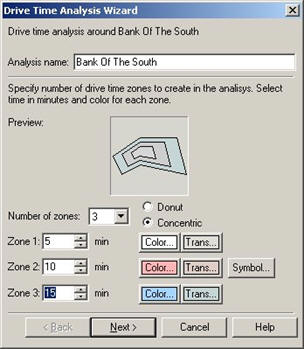 |
From this dialogue, I selected to 5, 10 and 15-minute drivetimes.
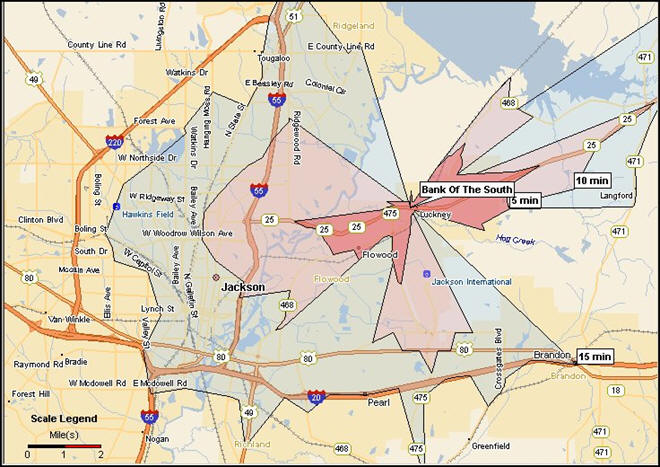 |
Now that I have created drivetime polygons, I can generate reports about those geographies. The templates for these reports generate MS PowerPoint images or Excel files automatically. All reports contain the and tables, charts and other information specific to the type of report template selected.
 |
Step 3
The first report I created was a demographic profile (below). This report is produced in MS PowerPoint and includes a set of slides for each drivetime polygon. You have a chance to modify some of the elements of the reports - depending on which template is used, including the title. I just used the defaults here.
 |
Step 4
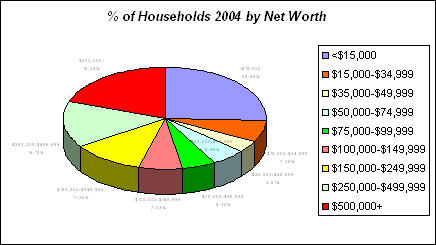
Then I created a net worth profile. This is probably a better assessment of economic strength of households than income. The table below is from the report for the 5-minute drivetime polygon; 10 and 15 minutes tables are in the complete report.
 |
This is this same data as a chart.
 |
Step 5
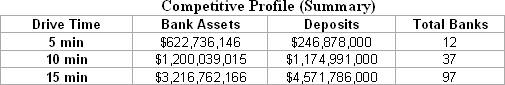
The next report is the competitive profile. The table below is the summary at the top of the report showing the assets, deposits and the total banks within each of the drivetime polygons. The complete report includes the data for the individual drivetime polygons, including a list of all the banks in that geography, the bank names, the branch names, branch numbers, deposits and assets.
 |
Step 6
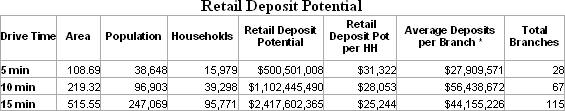
The next report is deposit potential. This table and graph come from that report.
 |
 |
Step 7
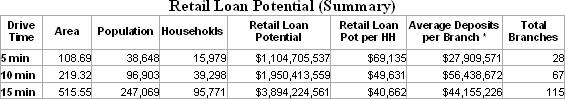
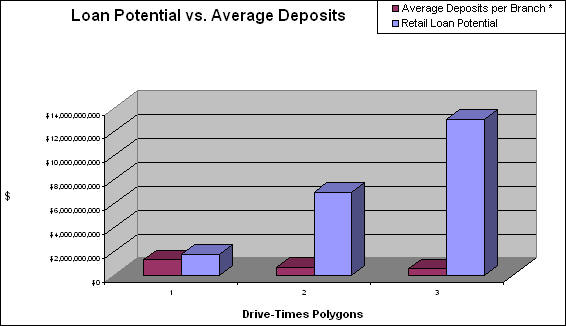
Retail loan potential is the fourth report I created. The summary table and a chart showing the retail loan potential come from that report.
 |
 |
Step 8
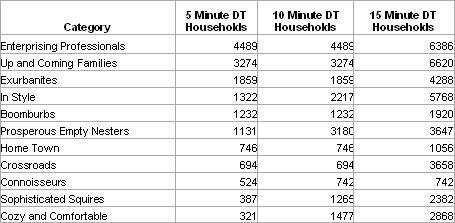
The chart below is based on the LifeModes Tapestry data. As in the other reports, this report uses the drivetime polygons, and a list of the categories and the number of households for each drivetime and category.
 |
 |
Color Coding Map
The screen below includes a wealth of information. Bank locations are represented by circles and the amount of each deposit is shown by the size and color of the circle. This information is then overlaid on census tracts thematically color-coded to show deposit potential. Bottom line - bankers can see their location, their competitor's location, the growth potential they have at that location, and potential of other under-served locations.
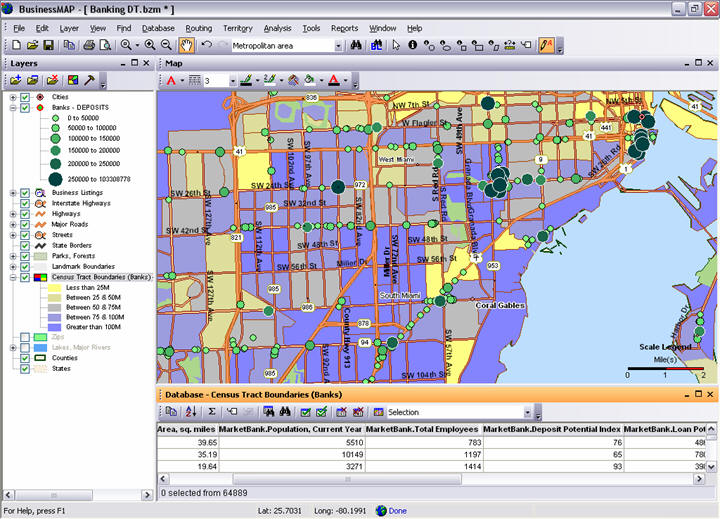 |
I've only shown some of the features of BusinessMAP Financial in this workflow. All these reports required minimal effort and ran almost automatically. With the demographics, deposit, loan potential and the lifestyle information from Tapestry, this eight-step workflow provides a comprehensive profile of this particular bank and the environment it is operating within. The entire process took just a few minutes.
You can do even more with additional data - BusinessMAP Financial comes with a catalog of additional data products. If we had customer data for this bank, we could map customer locations, too, to see concentrations within the drivetime polygons. We could also use customer location information for direct marketing or even rank them geographically by deposits or loans. By understanding some of the basics, such as who lives around the branch and what are their characteristics, we can understand how best to maximize the product mix for the branch and understand how it can be best positioned among its competition.
Ed. note: Hal Reid has performed several consulting engagements relating to ESRI's BusinessMap. These have primarily been in the area of contributions to the content of the user's manual and exploration of augmented or new features, and do not affect his ability to provide an impartial review of this product.
From Our Homepage
Saying Farewell to an Amazing Journey
Communicating with Maps
Is There a GIS Career Ladder?
What does it mean to be geospatially smart? Series
Ways Real Estate and Property Developers Utilize Melissa GeoData for Data-Driven Decisions
Unlocking Value From Daily Satellite Imagery and Insights
Maximizing the Value of Your Address Data with Geo Addressing
How Indoor Mapping Enhances the Security of Smart Buildings
Look Ahead: AI, Location Intelligence and Efficiency
Collaboration Takes on Sea Level Rise & Dynamic Technology Environments
Brownies for Brownfields
Has Everything Been Mapped Already?
How Is Data Literacy Changing in an Artificial Intelligence Landscape
Portfolios for GIS Professionals: More Than Just Maps
How to Create a Distance Matrix in QGIS - A Step-by-Step Guide
7 Ideas for Bringing GIS into the K-12 Classroom
The Geography of Movement