Since 1790, the U.S. has conducted a census, an empirical measure of the country’s population. Mandated in the U.S. Constitution, its importance to our democracy is equal to that of elections, and both are affected by, and affect, the results of the census.
In the last 230 years, of course, methodologies and technologies have changed and evolved. What hasn’t changed is the importance of the census and the data it delivers. Census data are used to determine congressional representation, identify vulnerable populations, and quantify our nation’s always-changing demographics.
1790 isn’t that long ago.
The continuous decadal census of the U.S. is admirable. We’ve been doing it without fail for 230 years. But, thousands of years before the U.S. even existed, other civilizations were doing similar demographic inventories.
The first known census found in historical and archaeologic records was that of the Babylonians, conducted in 3800 B.C. The ancient Egyptians and Chinese also conducted censuses, and all were based on a similar goal: determining how many people are there, how much they have, and how much can be taken without starving them.
How it works
Fortunately, the American census has higher aims. The first map included in the census of the U.S. was made in 1854, and is interesting for several reasons. It is coarse, contains no boundaries nor population information, and is divided only into four regions based on continental watersheds. However, it was a seminal effort to make geography relevant to the census.
Census mapping has progressed significantly since then. Even by 1860, mapping had seen significant improvement and sophistication, blending statistical data with maps in what could possibly be one of the first examples of geographic information systems. (The map of General Sherman’s march, discussed below, is a prime example.)
Entering the digital age, data from the census, and developed for the census, became one of the first nation-wide GIS databases, the famed TIGER database, delivered in 1990.
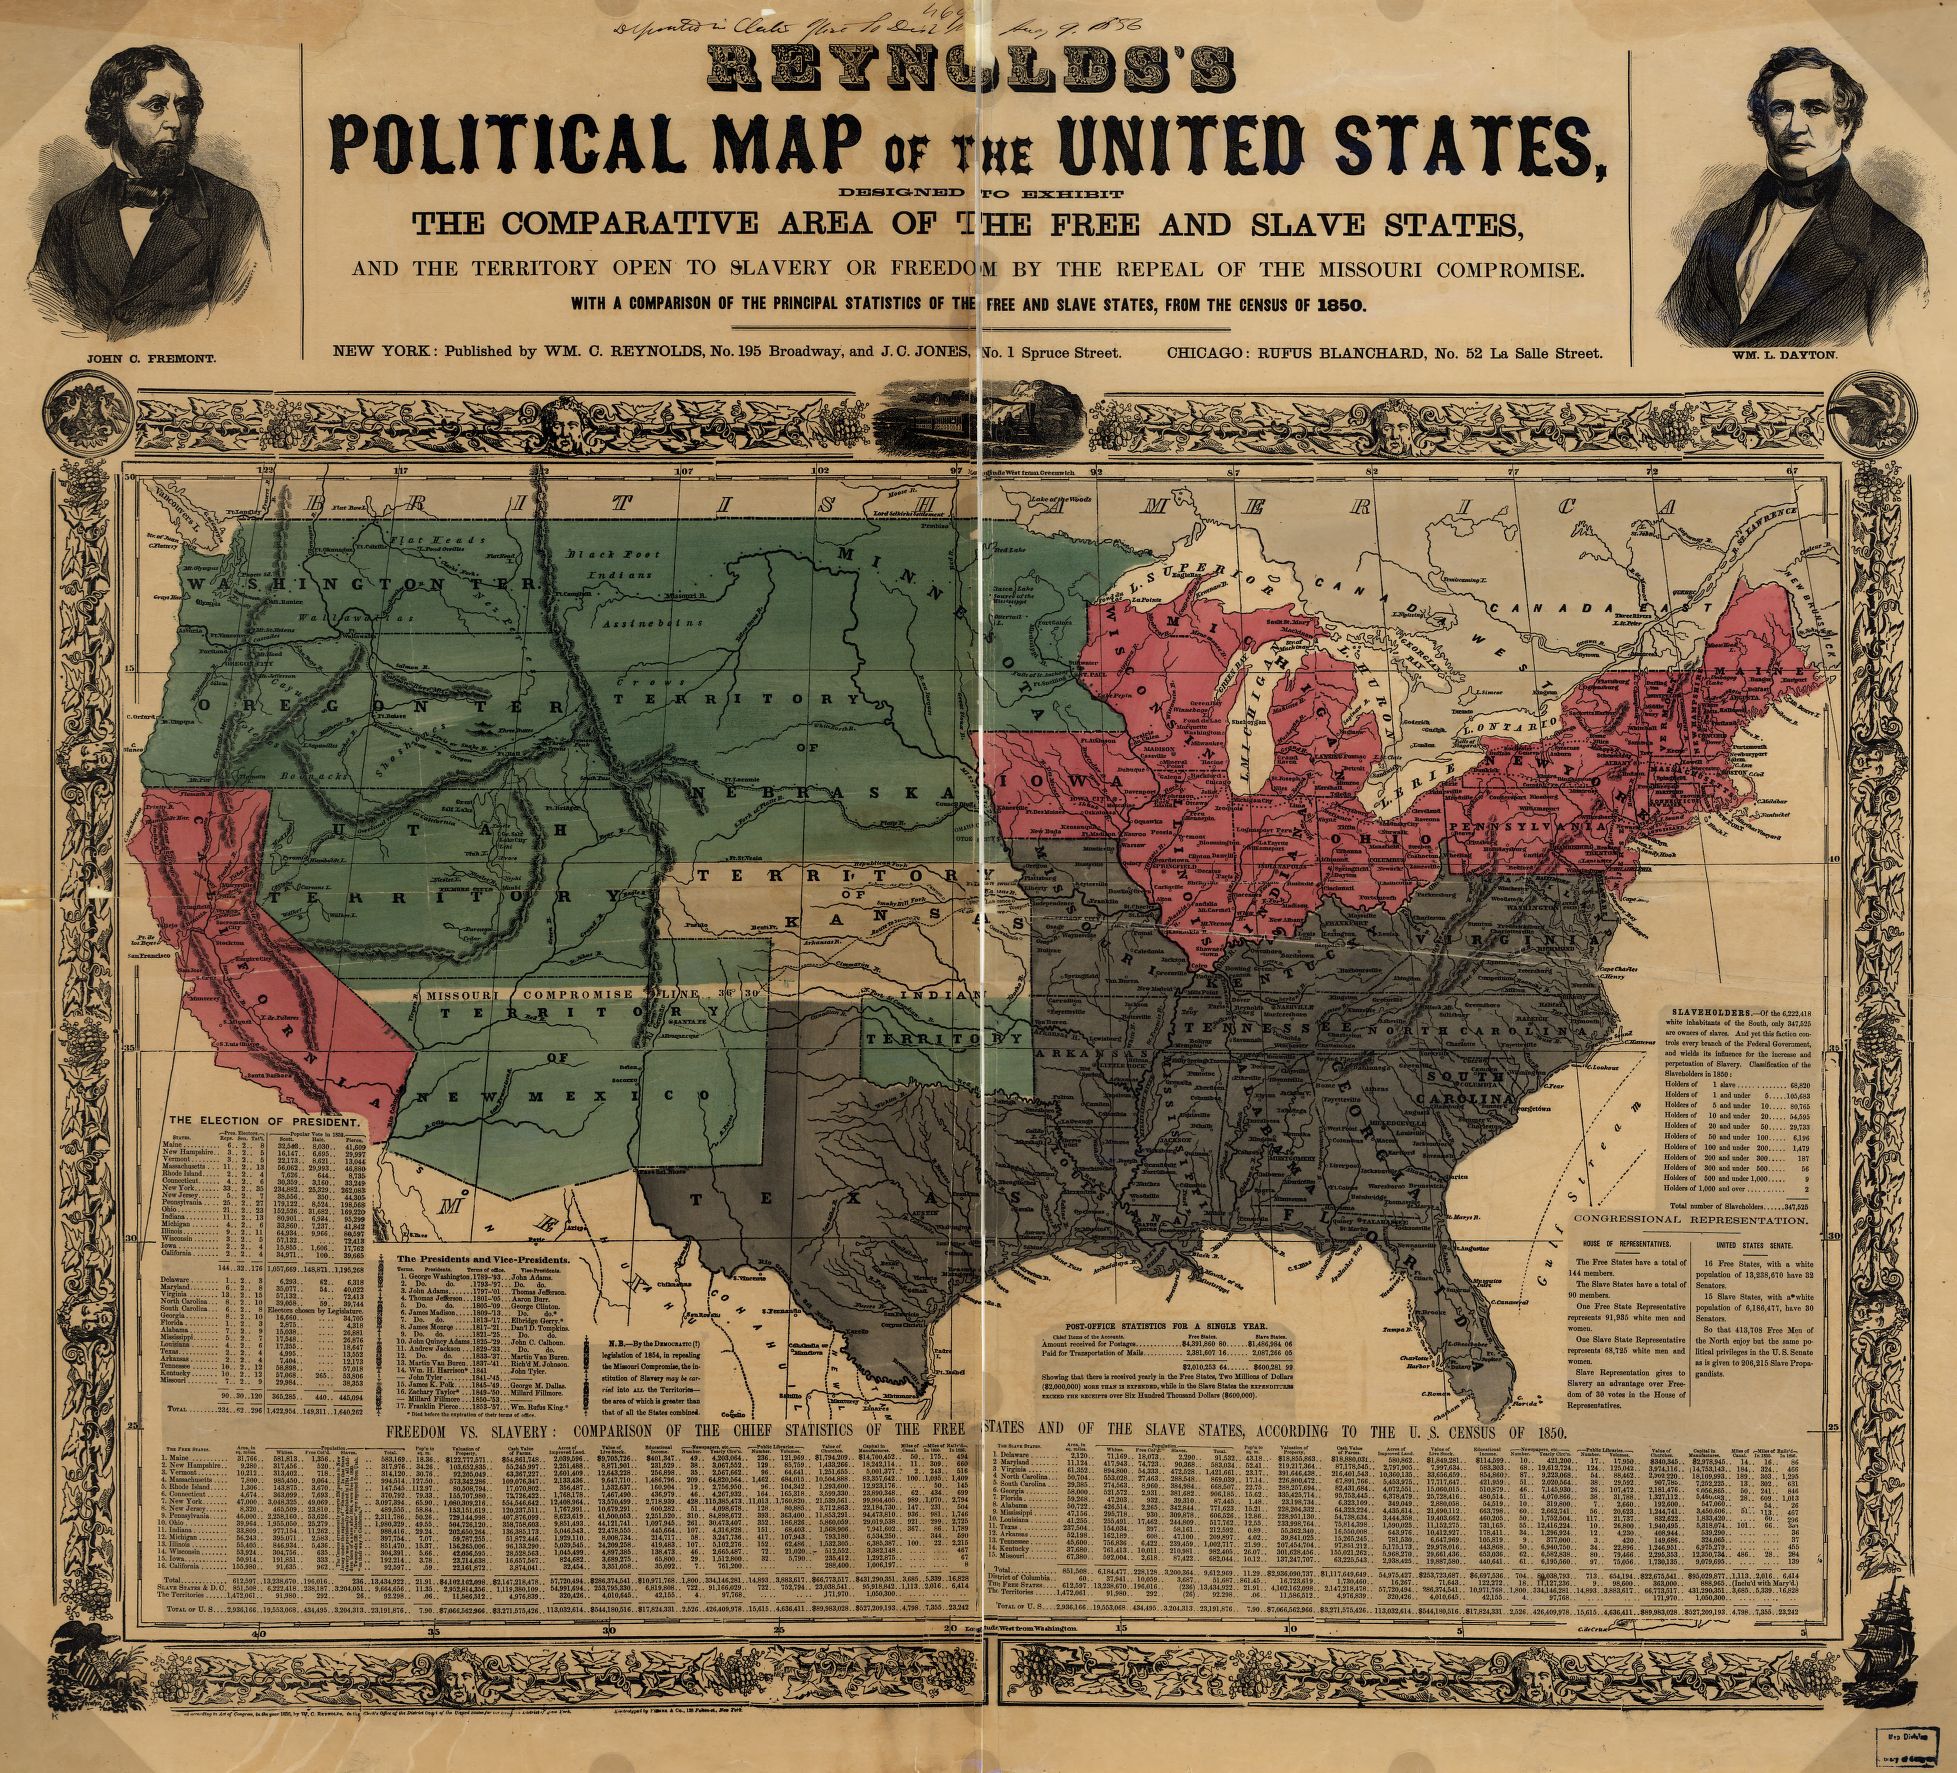
Reynolds's political map of the United States, designed to exhibit the comparative area of the free and slave states and the territory open to slavery or freedom by the repeal of the Missouri Compromise. https://www.loc.gov/resource/g3701e.ct000604/
What is a block group?
County and state boundaries in the U.S. are generally static and well-mapped. As statistical methods and mapping technology evolved, it became possible to map demographics at a much more detailed level, but no existing mapping units existed for that purpose, so the census cartographers developed a more granular system. Thomas Mueller at the GeoTech Center explains this much more eloquently that I can, but it breaks down into a nested hierarchy of spatial units based on state and county boundaries and areas of equal population.
Beyond the state and county levels, there are over 74,000 census tracts, each with a population of roughly 4000 people, and these are divided into census block groups. The smallest unit is a census block, of which there are several million in the U.S. and its territories! While tracts are delineated by population, many blocks do not have any population at all!
The U.S. Census Bureau offers these data for downloading, but downloading the data can be daunting. On a search for census blocks in my home county, there were 462 different tables and 462 different maps. To download each one would be exhausting!
Fortunately, there are online tools that streamline the process, with the data already consolidated and vetted. One excellent resource is Esri’s Living Atlas, which offers ready-to-use map services for AGOL, Desktop and Pro. Not only does it have layers for the U.S., it also includes data for countries as diverse as Portugal and Fiji. Additionally, it has layers from the American Community Survey. Another census bureau product, the ACS is updated every five years using statistical sampling.
Why does this matter?
The census data determines many factors of government operations and funding. At the largest scale, it determines how many congressional seats each state has.
The Method of Equal Proportions law was passed by Congress in 1941. This capped the number of House seats at 435, each representing a district of roughly equal population. Consequently, some states with increased population may gain seats, while others that lose population may lose seats. When this happens, districts are redrawn. (Each state has two senators, regardless of population.)
This process has advantages and pitfalls. Districts are mapped by state legislatures, not Congress, and depending on the political dynamics, it can lead to gerrymandering, where one party can redraw district boundaries to favor their own demographic and disenfranchise other voters.
At the same time, census data also can be used to create more egalitarian voting districts. In southeast Utah, the Navajo Nation was able to re-draw gerrymandered districts to create a more fair representation reflecting the actual demographics of the county, giving the Navajo more equitable representation. This required extensive litigation, but ultimately resulted in success.

Photo: Census Bureau Archives https://www.census.gov/history/img/Census_Bureau_Geographers_Cartographers.jpg
How do we use it?
Census data, and the derived ACS data, can be powerful tools both in the workplace and in the classroom. Several of our students used these data on various projects, ranging from analyzing health metrics in our city to the comparative population of cattle vs. people in counties across the state.
At my first “real job,” we were building a GIS program from the ground up, with no data and the software still in shrink-wrap. TIGER line data was one of the first data sets we incorporated, at least giving us base maps from which to further build and refine our database. We used the roads data for geocoding, and the demographic data for determining how many people might be affected by a particular project.
I also used these data in several courses at the University of Washington. It is fascinating to see students and professionals start exploring the data. The data can not only answer questions, but create new ones. What is the correlation between population density and renters vs. owners?
Since the data can be very time-consuming to download and process, Esri has built two fantastic tools: Community Analyst and Business Analyst. Both require separate AGOL licenses, and offer powerful, ready-to-use data and tools for demographic analysis.
Census and war
Ideally, as in the U.S., a census is used to distribute both government funding and taxation equitably among the population. However, like all mapping endeavors, it can also be used for darker purposes.
Through 1250-1270, the Mongol empire undertook censuses of captured territories as they swept across Asia and Europe. These were used to demand resources, such as men of fighting age, livestock and crops, in exchange for a peace treaty (i.e., We won’t slaughter your entire city). These commandeered resources were then used to conduct further conquests.
In 1864, the American Civil War was still raging, but Union forces clearly had the upper hand. Rather than drag on the war through more battles of attrition, President Lincoln ordered General Sherman to conduct a devastating campaign to demoralize and break the Confederacy. Sherman was to march his army of 60,000 men from north Georgia to the Atlantic Ocean, living off the land. This strategy was both to feed his army and to deprive the enemy of food as winter approached.
Susan Shulten tells part of this story with a map of census data from that era. Sherman planned his march of destruction by using census maps to determine which counties had the most food and the fewest men of fighting age.
On a happier note…
In a previous article, I shared how a collective project built a street address database to increase voter turnout on Native American reservations. Hopefully, this also will lead to more accurate census results among people who have been historically under-represented.
First5 California, a state agency promoting early childhood success and health, identified areas of high teenage pregnancy, then overlaid these with tract-level demographic data from the census. This helped them allocate funding for programs and optimize the use of limited public resources for communities that are most in need.
People aren’t numbers, but numbers matter.
No system is perfect. Censuses have been used for nefarious purposes, and given the vast scope of the work involved and the data collected, there are certainly going to be failings and oversights. Like all data, they can be used for inclusion or exclusion.
In modern democracies, like the U.S. and the EU (which has a rich database for their 32 nations), data are publicly available and transparent. Errors can be corrected, and students, academics and professionals alike can use the data for the betterment of the population. So, we all must stand up and be counted. We are the people!