
What Is Cme Gap in Crypto? Why Gaps Fill And How to Find Them on The Bitcoin Cme Chart


The phraseCME gap in cryptoshows up constantly across trading communities, especially after the workweek and weekend transition. You may see comments such as, “There’s a CME gap near $62,000,” or “Bitcoin may move back to close the gap.” In crypto finance, many participants watch these empty zones on the Chicago Mercantile Exchange chart because they may influence market sentiment, short-term price expectations, and technical analysis.
So what does CME mean, what exactly is a futures gap, and why does it matter for Bitcoin? It is also worth asking how these gaps are created, how a trader can identify them, and whether they really tend to close. Our editorial team breaks the topic down step by step.
Before discussing why these gaps appear on a Bitcoin chart, it helps to understand the exchange behind them.
What CME Means
CME refers to the Chicago Mercantile Exchange, part of CME Group and one of the best-known venues in global finance. It is a major futures exchange where participants can trade a wide range of derivative products tied to many asset classes.
| Asset Class | Example Products |
|---|---|
| Agriculture | Commodity products |
| Metals | Metals futures |
| Energy | Energy contracts |
| Interest Rates | Rate-based derivatives |
| Stock Index | Index instruments |
| Foreign Exchange | Currency market products |
| Cryptocurrency | BTC and ETH futures |
Over time, this Chicago-based marketplace also introduced cryptocurrency derivatives, giving institutional and professional market participants another way to trade digital assets through a regulated futures contract environment.
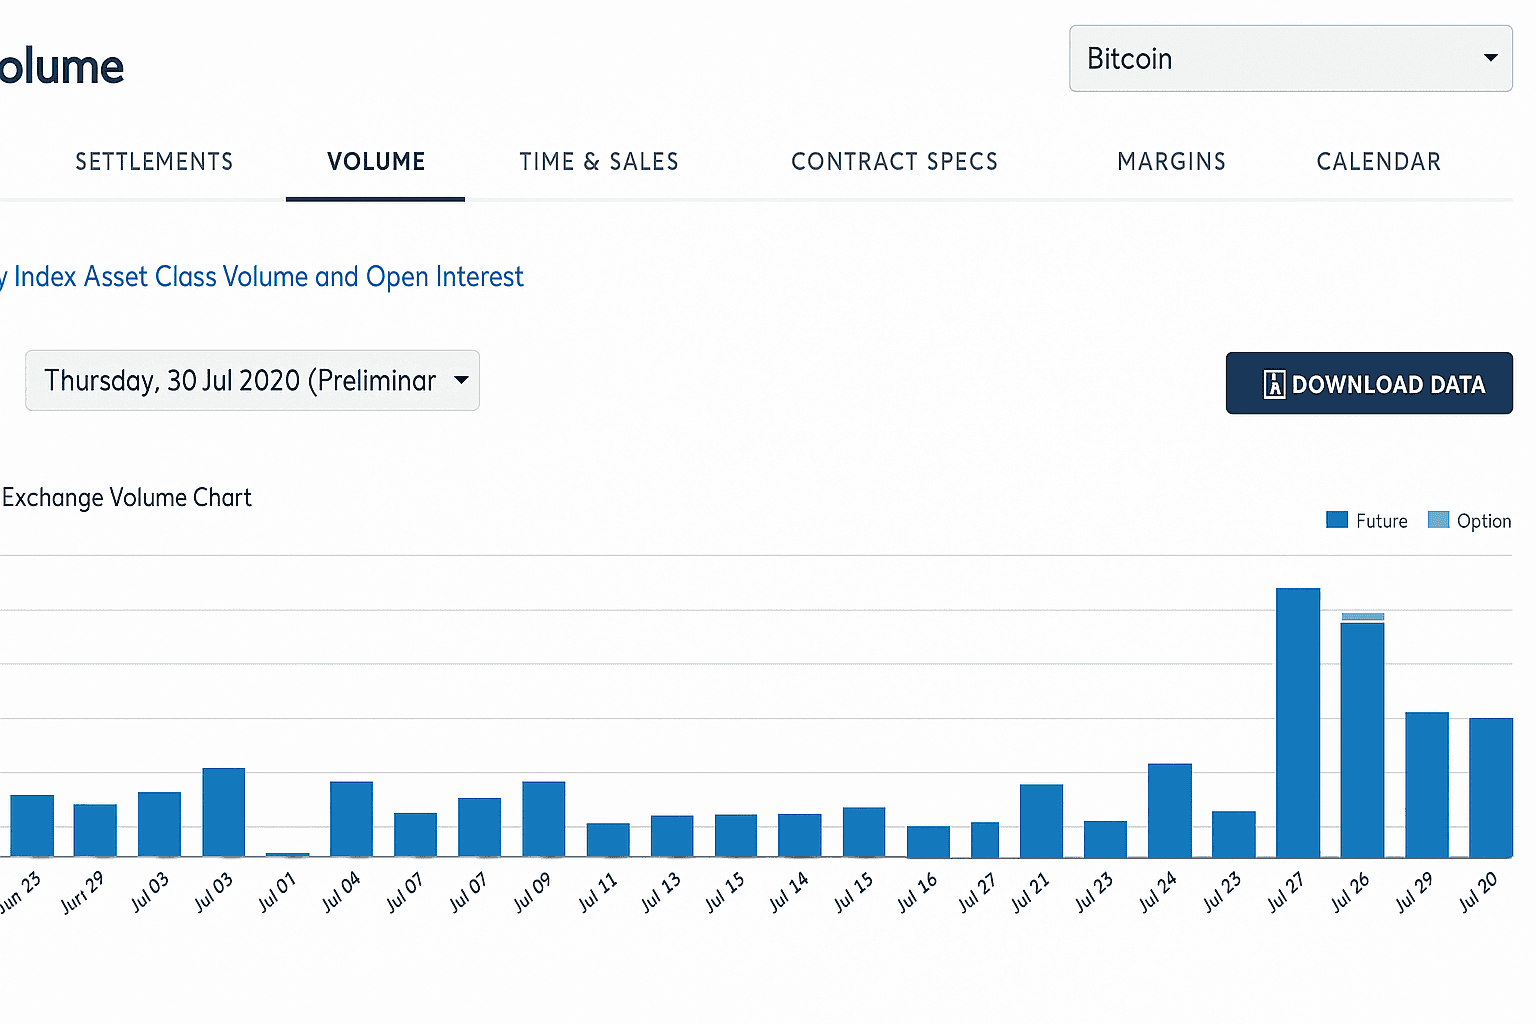
Bitcoin futures began trading on CME in late 2017. In 2026, BTC and ETH remain the primary cryptocurrency products that attract attention on this venue. Daily volume can be significant, which means the exchange contributes useful data for technical analysis even though it is not the main spot market for crypto trading.
What Is a Price Gap?
In simple terms, a price gap is a section on a chart where little or no trading took place. It appears as a blank area between one closing level and the next opening level. That empty zone reflects a jump in price rather than a smooth sequence of trades.
These gaps can form when volatility in finance increases suddenly and the market moves sharply upward or downward. They also appear when one market stops trading and then reopens at a noticeably different level. In stock market charts this is common, and the same idea applies to Bitcoin futures listed on CME.
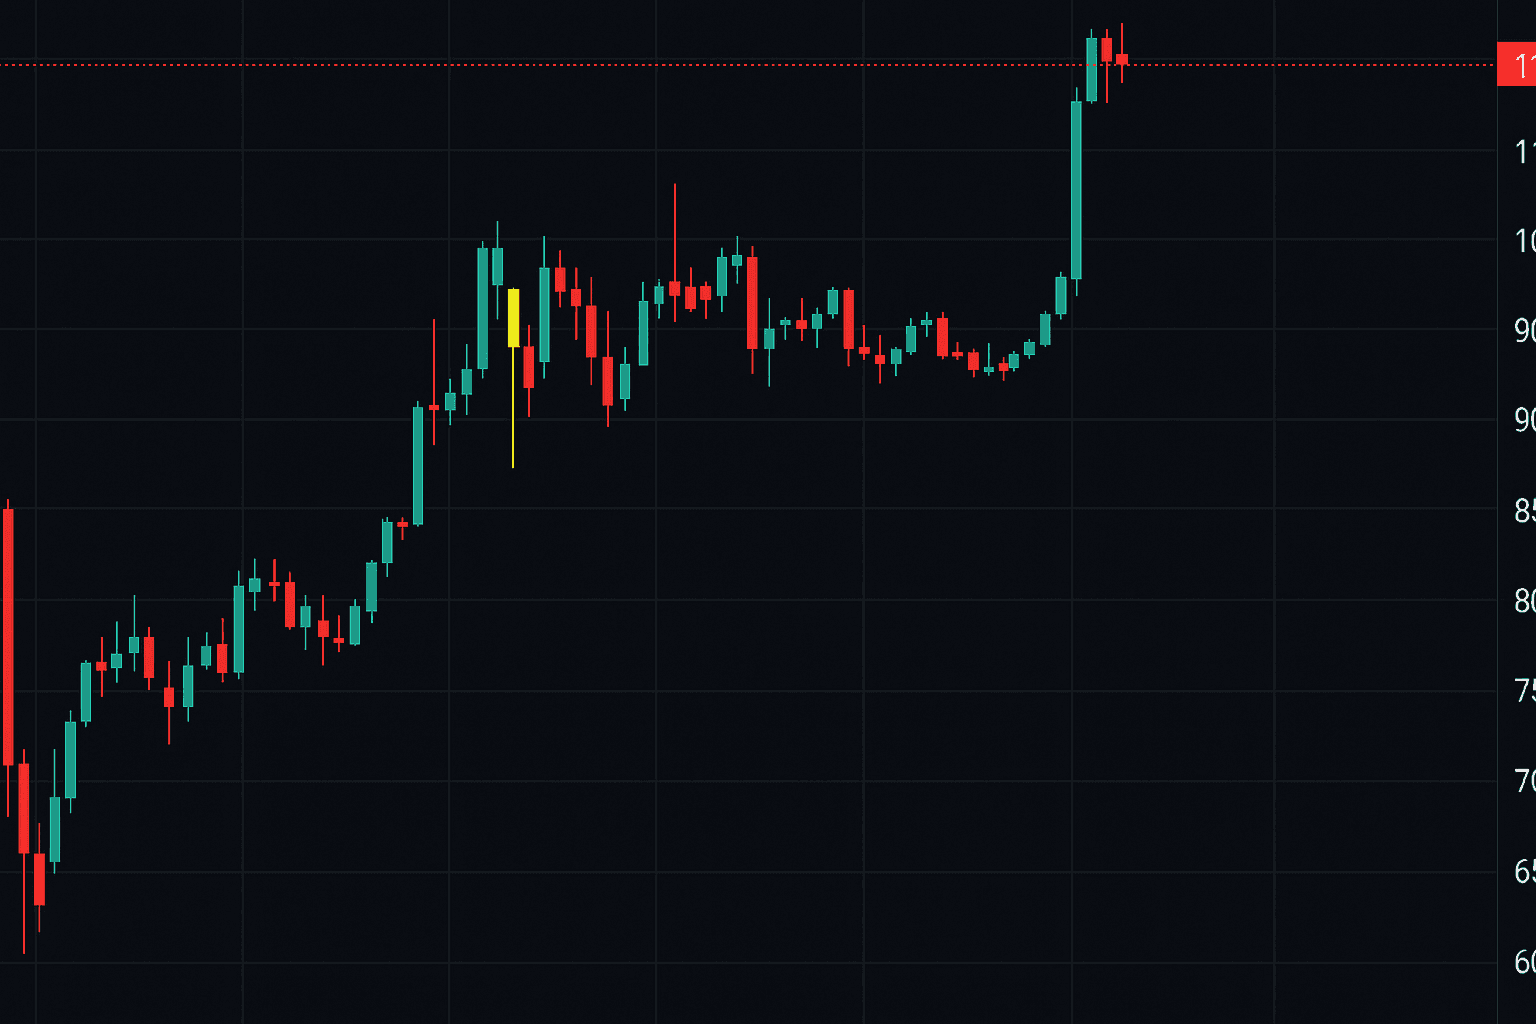
chart from 2020
Put another way, a gap is an untraded interval. It can emerge after a strong rally, a fast sell-off, or a session break where the next traded price is far from the previous close.
What Is a CME Gap?
A CME gap forms because Bitcoin trades nonstop on the broader cryptocurrency exchange ecosystem, but CME does not operate around the clock through the weekend in the same way. While the spot market stays active, CME Bitcoin futures pause. If Bitcoin makes a meaningful move while CME is closed, the futures chart can reopen with a visible blank range.
That is the core idea behind a CME gap in crypto. The gap exists because Bitcoin continues to trade elsewhere while the futures exchange is offline. When trading resumes, the CME chart adjusts to the current market price and leaves a gap between the earlier close and the new open.
For example, during a strong move in 2020, Bitcoin closed on Friday near $9,620 on CME. Over the weekend, the asset kept moving higher across the broader cryptocurrency market. When CME reopened on Monday, the next session began much higher, creating a large empty area on the futures chart.
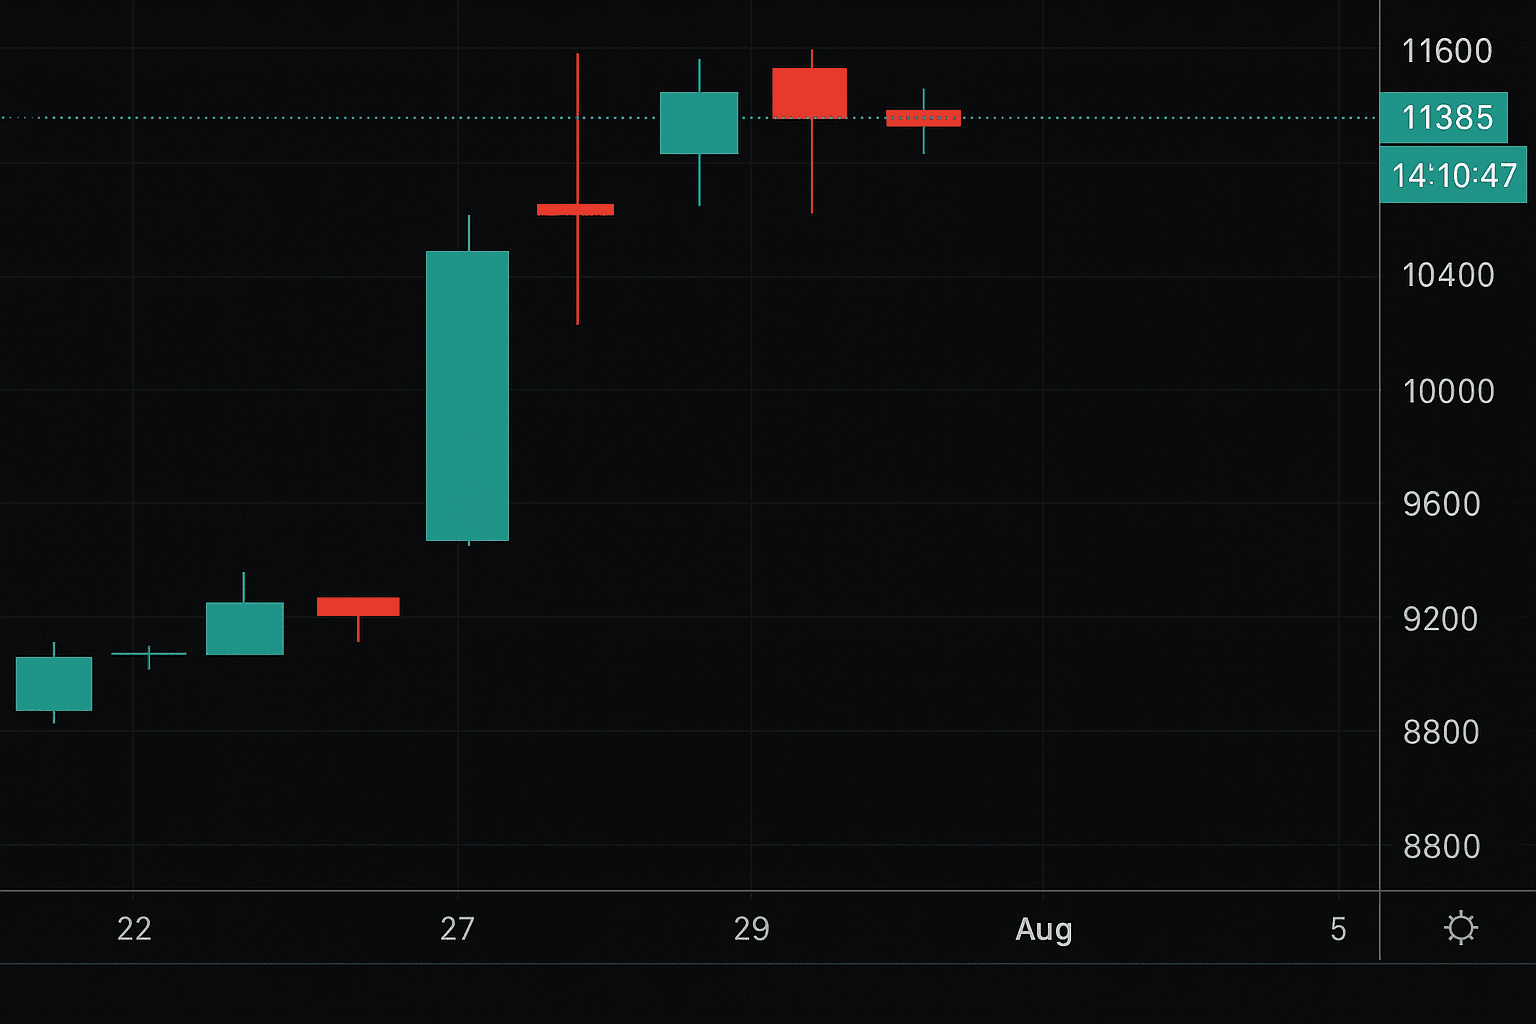
Once CME trading restarted, the opening price aligned with levels already established on other active venues. Because no trades had taken place inside that skipped range on CME, the chart displayed a gap between the Friday close and Monday open.
In that case, the market continued rising after the reopen, which left the gap untouched for a period of time.
How to Spot a CME Gap on the Bitcoin Chart
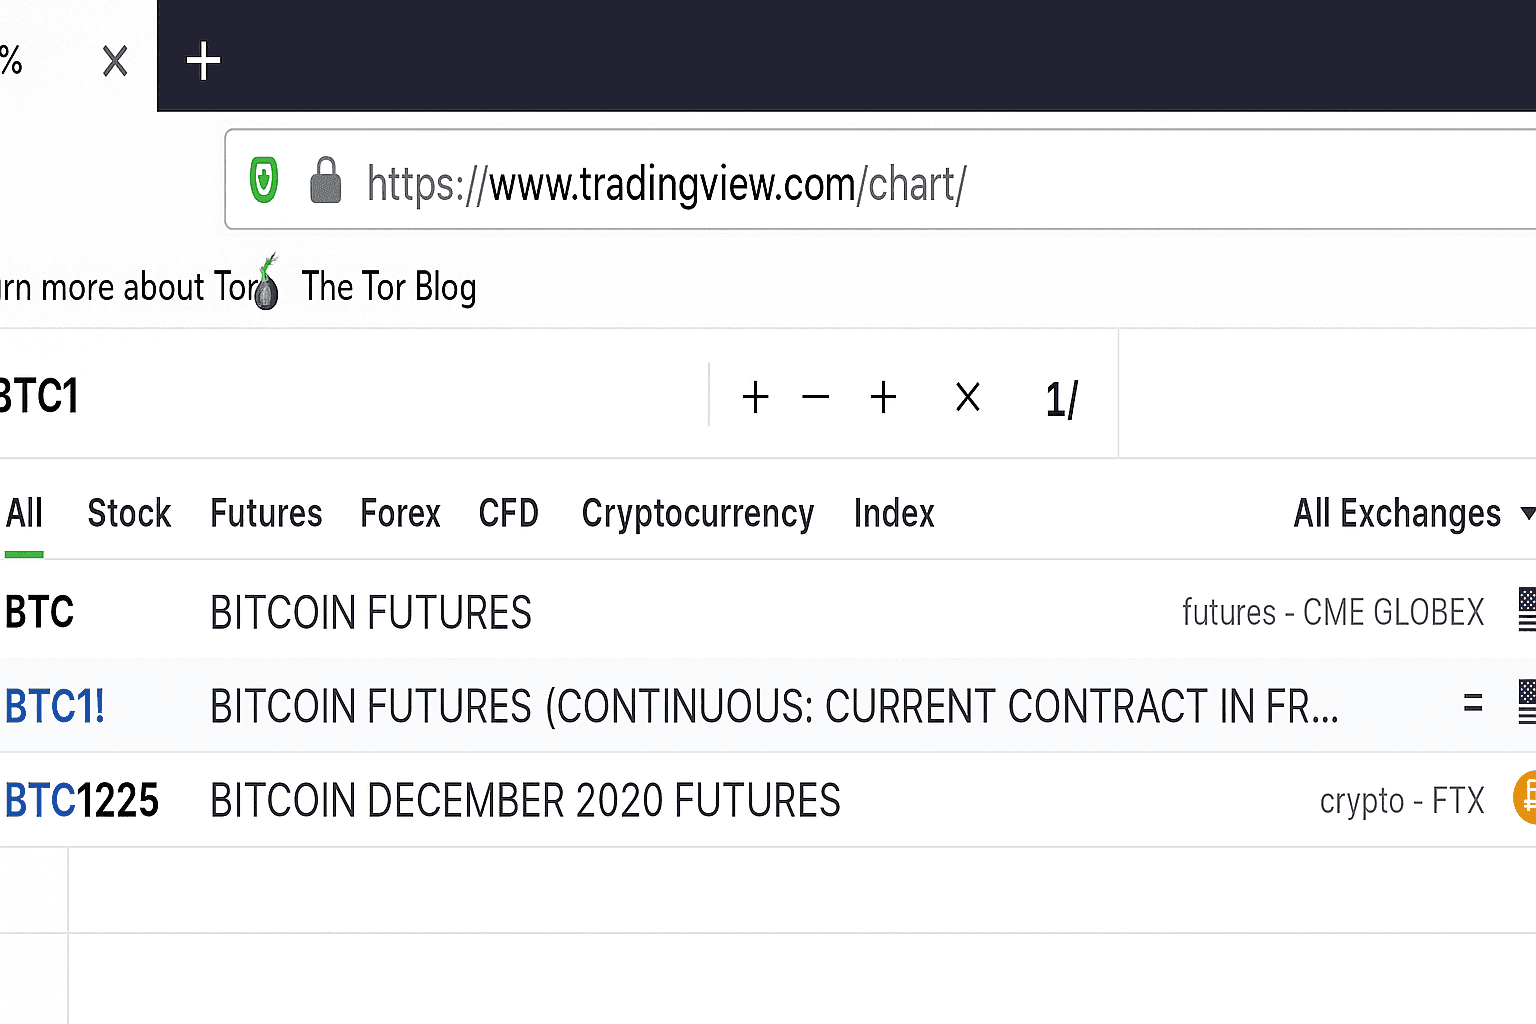
To identify one of these zones, open the Bitcoin CME futures chart on a charting platform and search for the continuous BTC futures symbol. After loading the chart, switch between time frames such as 1-hour, 4-hour, or daily and scroll back through previous sessions.
You are looking for a space where one candle closes and the next session opens significantly above or below it with no trading in between. Not every weekend creates a gap. It usually happens only when Bitcoin makes a meaningful move while CME is shut.
A practical way to check is to use a charting platform that offers CME Bitcoin futures data, load the continuous futures chart, and then compare the Friday close with the Sunday evening or Monday reopen. The main visual cue is a blank price interval between candles rather than a continuous wick or body. Zooming into the 1-hour or 4-hour chart often makes these areas easier to confirm than the daily view.
When market participants say a gap has been filled, they mean price later returned to that empty range and traded through it, bringing the chart back into the previously untouched area. After a fill, price does not follow one fixed pattern. Sometimes it reverses because the market has completed a retest, sometimes it continues in the same direction if momentum stays strong, and sometimes it consolidates around the gap before choosing a new direction.
Why Do CME Gaps Fill?
The tendency for gaps to close is not unique to Bitcoin, nor is it limited to CME Group products. Similar behavior appears across the stock market, commodity charts, and other derivative markets. Because of this, many analysts treat gaps as a useful point of reference during chart review.
There is no single proven law that explains why gaps fill. Some compare it to the old idea that empty space tends to get revisited, but in trading the better explanation is that markets often retest extreme moves.
- Liquidity
- Order flow
- Algorithmic trading systems
- Market sentiment
- Shifting probability estimates
All of these can pull price back into those skipped zones.
Another factor is that many traders watch the same levels. Once a gap becomes widely discussed, it may gain extra informational weight. A trader using technical analysis may see the area as unfinished business, while another may treat it as a magnet for future price action. That collective behavior can matter.Gap-filling in Bitcoin futures is best viewed as a recurring tendency, not a rule. Some gaps are revisited quickly, while others stay open far longer than traders expect.
Do Gaps Always Close?
No, they do not always close.
Still, historical Bitcoin charts show that many CME gaps eventually get revisited. Some are filled quickly, sometimes within the same trading day. Others take several days or a few weeks, and some remain open for months before price comes back. There are also cases where a gap stays unfilled for a very long time, which is why it is difficult to assign a reliable average fill time across all market conditions.
So the idea is not certainty, but tendency. The pattern has appeared often enough that many analysts monitor it, though relying on it as a guaranteed outcome would be a mistake. In markets, probability matters more than certainty, and risk rises when a trading strategy is built on just one signal.
In terms of predictive power, a CME gap can be statistically interesting without being decisive. It may help define levels that the market later revisits, but it does not reliably predict exactly when price will return or what will happen immediately after the gap is filled.
Using CME Gaps in a Trading Strategy
A CME gap can be a useful reference point, but it should not be treated as a stand-alone reason to enter a trade. Bitcoin price behavior is shaped by much more than one gap on a futures chart.
- Volume
- Support and resistance
- Market trend
- Derivatives positioning
- Option flows
- Spot market demand
- Broader macro finance conditions
All of these play a role.
For example, a market can leave a gap below current price and still keep rallying if momentum remains strong. In another case, a gap above price may never act as a target if bearish sentiment takes control. A short position based only on the assumption that price must return to a gap can become dangerous very quickly during high volatility.
Professional traders often use gap levels as one piece of information within a larger framework. That framework may include chart structure, liquidity zones, trend direction, order-book behavior, and cross-market signals from stock and foreign exchange market instruments. Some desks also combine gap analysis with algorithmic trading models that process historical data and current momentum conditions.
A common approach is to wait for price to move back toward the gap, then look for confirmation from volume, support and resistance, or momentum indicators before entering. Some traders place a stop-loss beyond the recent swing high or low rather than directly inside the gap, while profit targets may be set at the far side of the gap or at a nearby liquidity zone. Others use the gap only as a context level and avoid trading it unless the broader trend supports the setup.
Risks of Trading CME Gaps
Trading around a gap carries several clear risks. A gap can act like a false signal, drawing traders into positions that fail when price never returns to the level. Some gaps remain unfilled for a long time, and a market can continue trending away from them far longer than expected. Volatility can also increase around reopen periods, making entries worse and stop-loss execution more difficult.
There is also the risk of overreliance. A trader who treats every gap as a must-fill event may ignore changing market conditions, macro news, or stronger technical signals pointing elsewhere. In practice, losses can grow quickly if a position is sized too aggressively or held too long while waiting for a fill that does not happen.
In practical terms, the correct weight to assign a CME gap is moderate. It matters, but it does not override everything else.
Final Thoughts
If someone says Bitcoin may rise or fall to fill a CME gap, they are referring to an untraded area left on the Chicago Mercantile Exchange futures chart after weekend movement in the broader cryptocurrency market. These gaps form because CME closes while Bitcoin continues trading elsewhere.
Many of these gaps are eventually revisited, which is why they remain popular in technical analysis. Even so, they are not guaranteed to close, and using them in isolation can expose a trader to unnecessary risk. A better approach is to treat them as part of a broader analysis that includes price structure, derivative positioning, market sentiment, volatility, and the behavior of related markets such as stock and commodity products.
That is the essential idea behind a CME gap in crypto: a visible blank range on the futures contract chart that traders monitor for possible future interaction, not a promise that the market must move there next.


No comments yet. Be the first to share your thoughts.