
Copernicus Data Helps Shape Faster Disaster Response


A new white paper looks at how satellite-based information can be used to anticipate and respond more effectively to climate-driven disasters.
The document was issued jointly by the EU Agency for the Space Programme, or EUSPA, and the European Insurance and Occupational Pensions Authority, EIOPA.
Its focus is practical: how earth observation data can strengthen oversight of natural catastrophe risk and help measure how severe weather affects Europe’s insurance ecosystem.
With climate change bringing more frequent shocks and heavier economic damage across the European Union, the case for better risk management is getting harder to ignore. In my own review, that was the central thread running through the paper: resilience now depends in part on better data, better forecasting, and tools that can be used quickly when conditions shift.
How the Joint Project Uses Earth Observation
The white paper grows out of a shared pilot effort between EIOPA and EUSPA. Its main conclusion is that open data from the Copernicus Programme can materially improve how natural hazards are monitored and managed.
The project shows that satellite-derived earth observation can provide independent, objective, and near real-time geospatial information. For anyone who has worked with GIS or mapping systems, that matters. I tend to read this kind of workflow like layered map analysis: once the data set, location, and timing line up, the signal becomes much more useful for decision-making. In this case, that clearer signal can support insurers, supervisors, and affected communities.
The paper also reinforces the value of a broader technical stack around Copernicus, including satellite imagery, in situ inputs, data processing pipelines, cloud computing, API-based delivery, and user interface design that makes results usable in a web browser. That mix is what turns raw observation into something operational.
What Copernicus Provides and Who Runs It
Copernicus provides several kinds of earth observation data and information, including satellite imagery, atmospheric monitoring, marine data, land monitoring, climate indicators, and emergency management products. In practice, that means users can work with radar and optical imagery, land cover and vegetation layers, air quality observations, ocean state measurements, and event-specific mapping products generated during crises.
The program is built around a European institutional structure. The European Commission leads the overall program, while ESA supports the space component and the Sentinel missions, EUMETSAT contributes to operational delivery for parts of the system, and additional service providers help run downstream services and data distribution. From what I have seen, that kind of division of labor matters because reliable earth observation depends not only on satellites in orbit, but also on steady processing, validation, and delivery on the ground.
Access, Licensing, and the Data Space Ecosystem
One practical point often missed is that Copernicus data is generally available under a free and open access policy. That means users can view, download, and work with a large share of the data without paying licensing fees, although normal terms of use and service-specific conditions can still apply depending on the platform or product.
The Copernicus Data Space Ecosystem is the main environment built to support data access and distribution. In simple terms, it acts as a shared access layer where users can discover datasets, browse products, retrieve files, and connect through online tools rather than treating each source as a separate island.
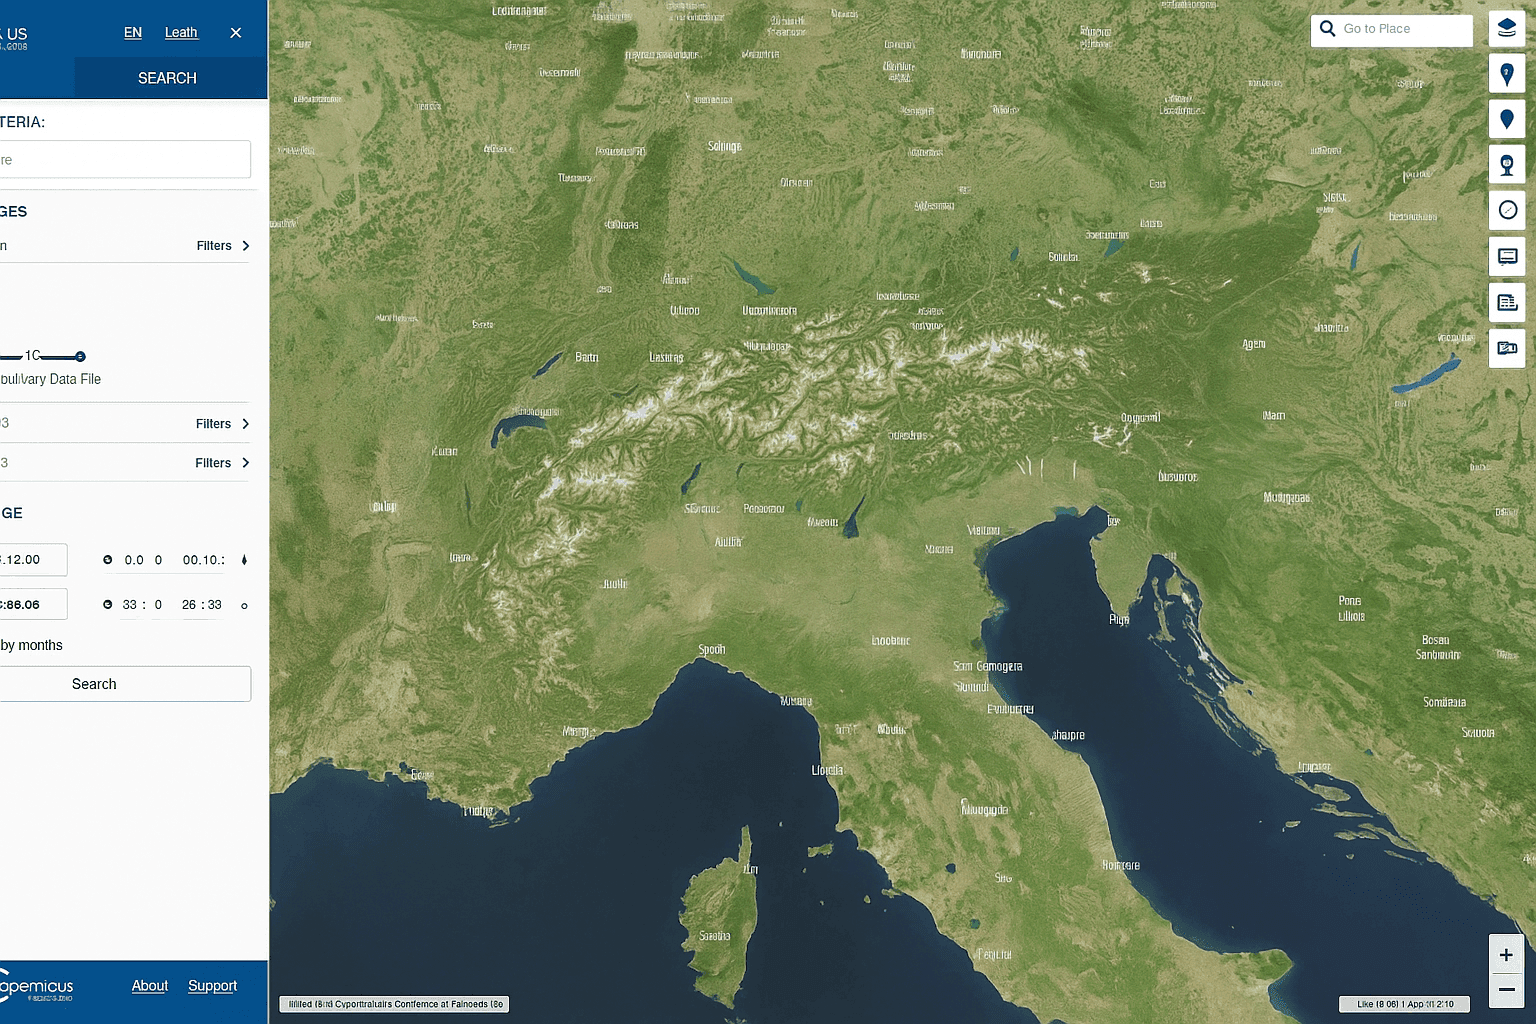
Access usually happens through web portals, browser-based viewers, APIs, and cloud-enabled platforms that let users search, visualize, and process data without always moving large files locally. I looked at this a bit like checking map layers through different interfaces: some users just need a portal to inspect a scene, while others need API access and cloud tools for repeat analysis.
For analysis, Copernicus is supported by visualization services, cloud processing environments, downloadable products, and machine-to-machine access through APIs. User-facing services vary by use case, but the general pattern is consistent: browse, filter, inspect, process, and then export what is needed for operational work.
Why Copernicus Matters for Insurance Supervision
Earth observation technology, especially the traceable open data available through the Copernicus Programme and services linked to the European Space Agency, can improve several parts of the supervisory process. It can sharpen risk identification, support stronger scenario design, and speed up early loss estimation after a major event.
That capability draws on a wide observation ecosystem across Earth, atmosphere, ocean, land, and the natural environment. Copernicus relies on several Sentinel missions and other sources to generate information that can be mapped, analyzed, and compared. From what I have seen in geospatial workflows, the usability of a system often depends less on one machine or one satellite and more on whether the layers can be brought together cleanly enough to support sound data analysis.
- Sentinel-1: Radar imaging used for all-weather monitoring, including flood extent and ground movement.
- Sentinel-2: Optical imagery used for land monitoring, vegetation, and surface change detection.
- Sentinel-3: Ocean and land monitoring focused on variables such as surface temperature, color, and topography.
- Sentinel-5 Precursor: Atmospheric monitoring focused on air quality and trace gases.
- Other sources: Additional satellites, in situ observations, and service inputs that help complete the wider Copernicus picture.
As a data source, Copernicus is generally treated as reliable because it is designed for operational use and supported by established processing and quality-control workflows. The value is not that every layer is perfect in isolation, but that the system is built to produce repeatable, validated information that can be checked against other inputs and used under time pressure.
What Financial Supervisors Can Do With It
- Quickly locate impacted zones and exposed insurers: Satellite imagery can be used to map affected areas while an event is still developing, including the spread and path of floods. That spatial information can then be matched with Solvency II reporting to estimate likely effects on specific insurance undertakings from a micro-prudential perspective. I looked at this the same way I would compare GIS layers on a map: hazard extent first, exposure second, then overlap.
- Produce early estimates of total losses: Once the micro-level picture is assembled, supervisors can scale the analysis to the wider market and build a macro-level view of sector exposure much earlier than with conventional reporting alone.
- Strengthen benchmarking, model checks, and stress scenarios: Objective reference data from earth observation can be used to test reported losses, validate model outputs, and improve scenario and stress-test design. That is especially useful when climate events move quickly and traditional ground reporting arrives in uneven patches, much like noisy GPS traces before they are cleaned up.
What the Partnership Suggests for Europe
The EIOPA-EUSPA collaboration underlines a fairly simple point: innovation is most valuable when it improves decisions under pressure. Used well, earth observation data can help build a more resilient and sustainable insurance sector in Europe, one better equipped to protect citizens and businesses as climate risks intensify.
When I checked the structure of the paper, it read less like a technology pitch and more like an operational policy document. That is probably the right approach. The value here is not just in the satellite, the cloud, or the data set by itself, but in turning observation into actionable information that can guide response when conditions on the ground change fast.


