
UK Scientists Launch Major Southwest Seabed Survey


The UK Centre for Seabed Mapping will carry out a new campaign, known as CSM2026, to examine and map the seabed along the southwest coast of the United Kingdom.
Four-Week Expedition Along the Coast
The work is scheduled from April 20 to May 19 and is divided into two legs, beginning in Lowestoft, Suffolk, and finishing in Falmouth, Cornwall. Over roughly four weeks at sea, 26 scientists from across the maritime research community will use advanced survey technology aboard the Research Vessel Cefas Endeavour to gather hydrographic, geological, and environmental data. When I mapped out the route mentally, it read a bit like linking survey lines across overlapping GIS layers: one continuous effort, but with several distinct data goals running in parallel.
A Rare Level of Maritime Cooperation
This project marks an unusually broad collaboration across the marine sector. By pooling specialist skills, equipment, and operational capacity into a single survey, the team expects to produce data that helps meet UK government commitments while improving how the seabed is mapped, interpreted, and managed. From what I have seen in large technical programs, combining efforts this way usually reduces duplication and gives a cleaner information picture, much like aligning multiple spatial datasets into one reliable map.International collaboration matters because seabed mapping is expensive, technically demanding, and far more useful when data standards and survey methods can be shared across borders.
Organizations Involved in UK CSM
UK CSM brings together more than 30 public sector bodies focused on collecting and sharing high-quality marine data. For this coastal mapping effort, 11 organizations are directly involved:
| Organization Name | Role/Contribution |
|---|---|
| Maritime and Coastguard Agency | Supports maritime safety, navigation priorities, and hazard awareness. |
| UK Hydrographic Office | Contributes hydrographic expertise and charting support. |
| British Geological Survey | Provides geological interpretation of seabed structure and sediments. |
| Centre for Environment, Fisheries and Aquaculture Science | Supports scientific survey operations and environmental data collection. |
| Department for Environment, Food & Rural Affairs | Helps align the work with marine policy and environmental management needs. |
| The Crown Estate | Uses seabed information to inform marine leasing and offshore development planning. |
| Historic England | Brings interest in submerged heritage and underwater archaeology. |
| Joint Nature Conservation Committee | Supports habitat assessment and marine conservation planning. |
| Agri-Food and Biosciences Institute in Northern Ireland | Contributes marine science and regional research capability. |
| Natural England | Uses seabed data for habitat protection and environmental assessment. |
| Royal Navy | Adds operational interest related to defense, navigation, and maritime domain awareness. |
What Seabed Mapping Means and Why It Matters
Seabed mapping is the process of measuring the depth, shape, texture, and physical character of the ocean floor and the shallow layers beneath it. In simple terms, it is how scientists build a usable picture of underwater terrain, much like turning scattered points into a coherent map. That matters far beyond a single UK expedition because governments, researchers, and industry all rely on accurate seafloor data to understand marine environments, reduce risk, and plan activity offshore.
Good seabed maps support far more than navigation. They help with offshore energy development, port and harbor planning, cable and pipeline routing, fisheries management, marine habitat protection, climate change research, underwater archaeology, and disaster preparedness. They also improve public safety and national security by identifying hazards, supporting naval operations, and giving responders better terrain knowledge after storms, coastal erosion events, or underwater landslides. Economically, they help maritime trade, guide resource management, and reduce uncertainty before large infrastructure projects move ahead.
Why the Survey Data Matters
During the voyage, onboard scientists will work alongside specialists from partner agencies, exchange methods, and collect seabed mapping data that supports a broad set of uses.
- Offshore energy
- Marine infrastructure
- Marine habitat and ecosystem science
- Navigation
- Safety at sea
- Policy planning
- Defense
- Fisheries management
- Climate change research
- Underwater archaeology
- Cable and pipeline routing
In practical terms, this kind of bathymetry and geophysics work helps build a better bathymetric chart of the coast and continental shelf, improves understanding of sediment movement, erosion, ocean current behavior, salinity, and temperature patterns in the water, and adds to wider oceanography and geology research. It can also reveal features such as ridges, canyons, sand waves, trenches, seamounts, hydrothermal vent fields in suitable settings, and shipwreck sites, while highlighting areas tied to landslide risk, submarine terrain, and the condition of the sea floor in parts of the Atlantic Ocean. I looked through the scope the way I would inspect noisy GPS traces or a multibeam echosounder output: the value is not in one isolated reading, but in how the data points connect into a dependable picture of the earth, the ocean, and the coast. While this mission is centered on UK waters rather than the Pacific Ocean, the same mapping technology and shared information standards matter across the globe, from the United States to New Zealand, wherever governments and researchers need better seabed maps for science, infrastructure, safer use of the sea, and more informed resource decisions.
How Seabed Mapping Is Carried Out
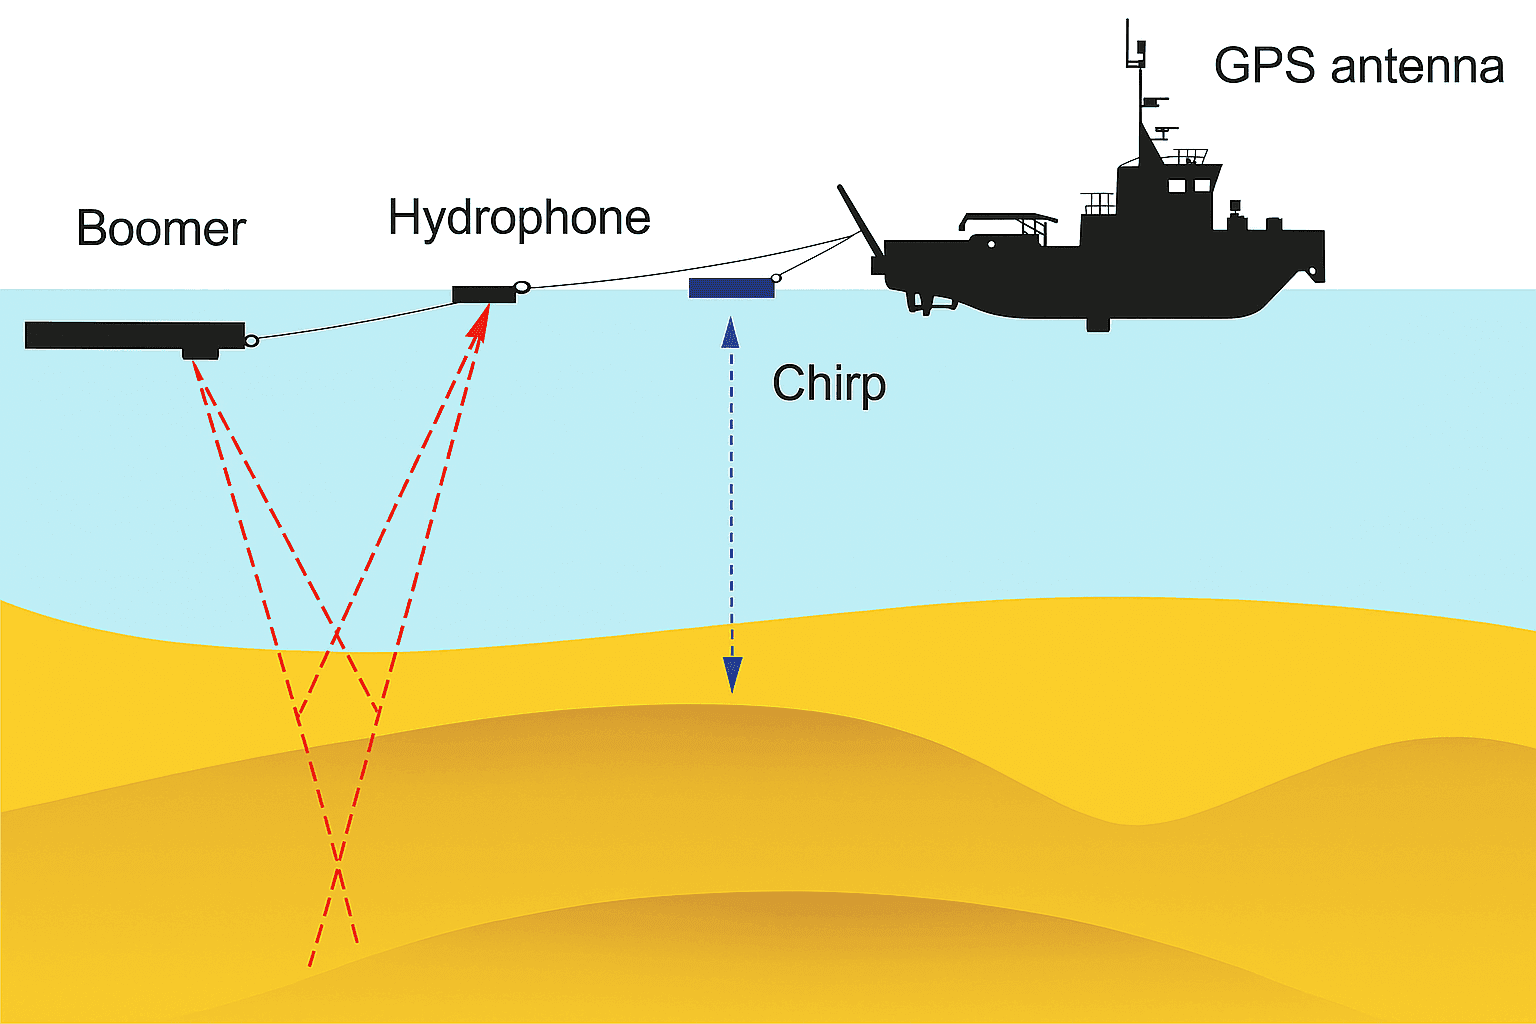
Most seabed mapping starts with survey vessels running planned lines across an area while onboard systems record depth and seafloor characteristics. The core method is bathymetric surveying, which measures water depth and turns those readings into a gridded model of the seabed. Teams often combine that with geophysical and environmental sampling so the final output shows not just shape, but also composition and condition.
Common technologies include multibeam echosounders, which send sound pulses in a wide swath to measure depth and create detailed terrain models; side-scan sonar, which images the texture and objects on the seabed surface; sub-bottom profilers, which look beneath the seafloor to reveal shallow buried layers; and remotely operated vehicles, which are used for close inspection, visual confirmation, and work in places where a ship-based reading needs ground truth. Depending on the mission, teams may also use autonomous platforms, sediment samplers, positioning systems, and water-column sensors to connect seafloor data with broader marine conditions.
National and Global Mapping Efforts
The UK survey fits into a much wider push to improve knowledge of the ocean floor. Other countries also run major national programs through hydrographic offices, geological surveys, naval agencies, and ocean science institutions, including efforts in the United States, Canada, Japan, Australia, and New Zealand. These programs usually combine safety, science, infrastructure planning, and environmental management goals.
At the global level, one of the best-known initiatives is Seabed 2030, which aims to compile and improve a complete map of the world ocean floor using contributions from governments, research groups, and private-sector partners. In my analysis, that kind of shared framework matters because no single country can map the entire ocean efficiently on its own. International coordination helps align standards, reduce duplicated effort, and make data more usable across borders.
Challenges and Future Directions
Seabed mapping still faces some stubborn constraints. Large areas of the ocean remain expensive and time-consuming to survey, weather can cut into vessel schedules, and deep water creates technical limits for both data collection and verification. There are also funding pressures, uneven data coverage, and the ongoing challenge of turning raw survey output into consistent, accessible products that different agencies can actually use.
Future work is likely to depend more on higher-resolution sensors, autonomous and remotely operated systems, faster processing, and stronger data-sharing standards. As these tools improve, mapping programs should become better at revisiting dynamic seafloor areas, detecting change over time, and combining bathymetry, geology, habitat data, and infrastructure information into more complete marine basemaps.
Where to Find More Information and Data
Readers looking for more seabed mapping information or public data can start with the UK Hydrographic Office, the British Geological Survey, the UK Centre for Seabed Mapping, the General Bathymetric Chart of the Oceans, and the Seabed 2030 project. Additional material is often available through national ocean agencies, marine data portals, and university research centers that publish bathymetry, geology, habitat, and survey metadata for public use.


